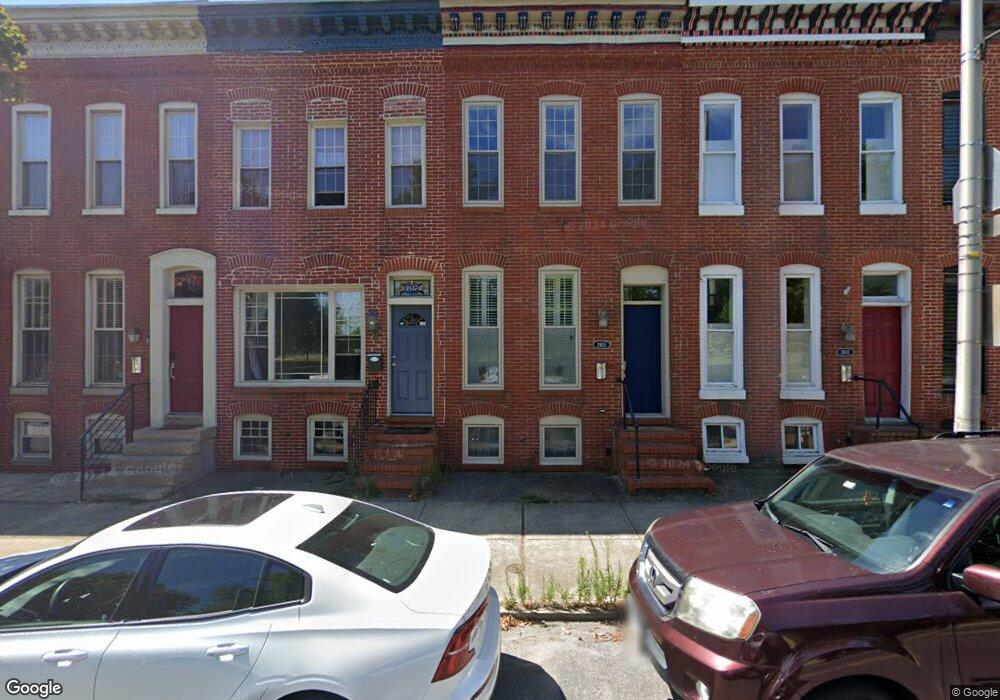
2615 Eastern Ave Baltimore, MD 21224
Canton NeighborhoodEstimated Value: $350,922 - $395,000
2
Beds
3
Baths
1,347
Sq Ft
$277/Sq Ft
Est. Value
About This Home
This home is located at 2615 Eastern Ave, Baltimore, MD 21224 and is currently estimated at $372,961, approximately $276 per square foot. 2615 Eastern Ave is a home located in Baltimore City with nearby schools including Booker T. Washington Middle School, Paul Laurence Dunbar High School, and Patterson High School.
Ownership History
Date
Name
Owned For
Owner Type
Purchase Details
Closed on
Jan 29, 2020
Sold by
Snyder Michael K
Bought by
Snyder Michael K and Hansen Kent W
Current Estimated Value
Purchase Details
Closed on
Nov 22, 2004
Sold by
Rozencwaig Maurice
Bought by
Snyder Michael K
Purchase Details
Closed on
Oct 28, 2004
Sold by
Rozencwaig Maurice
Bought by
Snyder Michael K
Purchase Details
Closed on
Mar 5, 2004
Sold by
Adams Beverly A
Bought by
Rozencwaig Maurice
Purchase Details
Closed on
Jun 19, 1997
Sold by
Secretary Of Housing
Bought by
Adams Beverly A
Purchase Details
Closed on
Jan 7, 1997
Sold by
Mazurek Brenton D
Bought by
Secretary Of Housing and Urban Development
Create a Home Valuation Report for This Property
The Home Valuation Report is an in-depth analysis detailing your home's value as well as a comparison with similar homes in the area
Home Values in the Area
Average Home Value in this Area
Purchase History
| Date | Buyer | Sale Price | Title Company |
|---|---|---|---|
| Snyder Michael K | -- | Lawyers Trust Title | |
| Snyder Michael K | $330,000 | -- | |
| Snyder Michael K | $330,000 | -- | |
| Rozencwaig Maurice | $95,000 | -- | |
| Adams Beverly A | $32,500 | -- | |
| Secretary Of Housing | $69,278 | -- | |
| Mazurek Brenton D | $69,278 | -- |
Source: Public Records
Tax History
| Year | Tax Paid | Tax Assessment Tax Assessment Total Assessment is a certain percentage of the fair market value that is determined by local assessors to be the total taxable value of land and additions on the property. | Land | Improvement |
|---|---|---|---|---|
| 2025 | $5,921 | $268,100 | -- | -- |
| 2024 | $5,921 | $252,100 | -- | -- |
| 2023 | $5,545 | $236,100 | $100,000 | $136,100 |
| 2022 | $5,572 | $236,100 | $100,000 | $136,100 |
| 2021 | $5,572 | $236,100 | $100,000 | $136,100 |
| 2020 | $5,247 | $239,000 | $100,000 | $139,000 |
| 2019 | $5,170 | $236,833 | $0 | $0 |
| 2018 | $5,191 | $234,667 | $0 | $0 |
| 2017 | $5,198 | $232,500 | $0 | $0 |
| 2016 | $5,490 | $225,833 | $0 | $0 |
| 2015 | $5,490 | $219,167 | $0 | $0 |
| 2014 | $5,490 | $212,500 | $0 | $0 |
Source: Public Records
Map
Nearby Homes
- 514 S Luzerne Ave
- 515 S Milton Ave
- 2510 Fleet St
- 2529 Fleet St
- 2519 Fleet St
- 615 S Rose St
- 607 S Milton Ave
- 2428 Fleet St
- 505 S Lakewood Ave
- 2526 Foster Ave
- 511 S Lakewood Ave
- 624 S Glover St
- 613 S Port St
- 2527 Foster Ave
- 518 S Kenwood Ave
- 2341 Eastern Ave
- 511 S Bradford St
- 519 S Kenwood Ave
- 2314 Fleet St
- 507 S Patterson Park Ave
- 2617 Eastern Ave
- 2619 Eastern Ave
- 2621 Eastern Ave
- 2613 Eastern Ave
- 2611 Eastern Ave
- 500 S Glover St
- 2609 Eastern Ave
- 2623 Eastern Ave
- 502 S Glover St
- 2607 Eastern Ave
- 2625 Eastern Ave
- 2625 Eastern Ave Unit B
- 2625 Eastern Ave Unit A
- 504 S Glover St
- 2605 Eastern Ave
- 2627 Eastern Ave
- 2603 Eastern Ave
- 2629 Eastern Ave
- 508 S Glover St
- 501 S Luzerne Ave
Your Personal Tour Guide
Ask me questions while you tour the home.