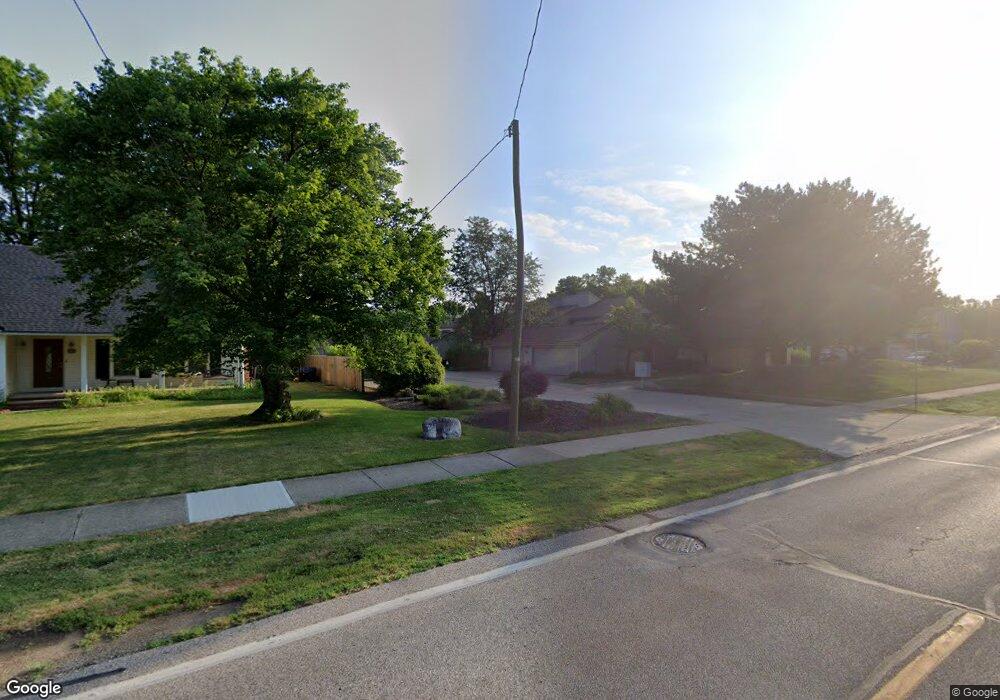
2615 Jackie Ln Unit 7 Westlake, OH 44145
Estimated Value: $194,000 - $253,000
2
Beds
2
Baths
1,368
Sq Ft
$160/Sq Ft
Est. Value
About This Home
This home is located at 2615 Jackie Ln Unit 7, Westlake, OH 44145 and is currently estimated at $219,409, approximately $160 per square foot. 2615 Jackie Ln Unit 7 is a home located in Cuyahoga County with nearby schools including Dover Intermediate School, Lee Burneson Middle School, and Westlake High School.
Ownership History
Date
Name
Owned For
Owner Type
Purchase Details
Closed on
Feb 27, 2002
Sold by
Mcmahon James P and Mcmahon Amy T
Bought by
Kapolka Alyce M
Current Estimated Value
Purchase Details
Closed on
Jun 20, 1998
Sold by
Forkosh Ronna H
Bought by
Parkhurst Jon J
Home Financials for this Owner
Home Financials are based on the most recent Mortgage that was taken out on this home.
Original Mortgage
$70,000
Interest Rate
7.18%
Purchase Details
Closed on
Aug 19, 1992
Sold by
Frimel Thomas
Bought by
Forkosh Ronna H
Purchase Details
Closed on
Jul 19, 1991
Sold by
Frimel Thomas A
Bought by
Frimel Thomas
Purchase Details
Closed on
Sep 10, 1990
Sold by
Jordanoff Gordon J
Bought by
Frimel Thomas A
Purchase Details
Closed on
Jan 1, 1982
Bought by
Jordanoff Gordon J
Create a Home Valuation Report for This Property
The Home Valuation Report is an in-depth analysis detailing your home's value as well as a comparison with similar homes in the area
Home Values in the Area
Average Home Value in this Area
Purchase History
| Date | Buyer | Sale Price | Title Company |
|---|---|---|---|
| Kapolka Alyce M | $110,500 | Prospect Title Agency Inc | |
| Parkhurst Jon J | $94,000 | Resource Title Agency Inc | |
| Forkosh Ronna H | $80,500 | -- | |
| Frimel Thomas | -- | -- | |
| Frimel Thomas A | $79,000 | -- | |
| Jordanoff Gordon J | -- | -- |
Source: Public Records
Mortgage History
| Date | Status | Borrower | Loan Amount |
|---|---|---|---|
| Previous Owner | Parkhurst Jon J | $70,000 |
Source: Public Records
Tax History Compared to Growth
Tax History
| Year | Tax Paid | Tax Assessment Tax Assessment Total Assessment is a certain percentage of the fair market value that is determined by local assessors to be the total taxable value of land and additions on the property. | Land | Improvement |
|---|---|---|---|---|
| 2024 | $3,403 | $71,820 | $7,315 | $64,505 |
| 2023 | $2,824 | $50,960 | $5,110 | $45,850 |
| 2022 | $2,779 | $50,960 | $5,110 | $45,850 |
| 2021 | $2,782 | $50,960 | $5,110 | $45,850 |
| 2020 | $2,333 | $39,200 | $3,920 | $35,280 |
| 2019 | $2,262 | $112,000 | $11,200 | $100,800 |
| 2018 | $2,014 | $39,200 | $3,920 | $35,280 |
| 2017 | $1,776 | $28,810 | $2,870 | $25,940 |
| 2016 | $1,766 | $28,810 | $2,870 | $25,940 |
| 2015 | $2,142 | $28,810 | $2,870 | $25,940 |
| 2014 | $2,142 | $34,300 | $3,430 | $30,870 |
Source: Public Records
Map
Nearby Homes
- 2549 Canterbury Rd
- 2750 Canterbury Rd
- #1 Fifth Ave
- 2965 Creekside Dr
- 2186 Canterbury Rd
- 28276 Hallberg Dr
- 28282 Hallberg Dr
- 28264 Hallberg Dr
- 25716 Westwood Rd
- 3107 Clark Pkwy
- 25715 Westwood Rd
- 25615 Hidden Acres Dr
- 26553 Hilliard Blvd
- 0 Hilliard Blvd Unit 5128276
- 27413 Westown Blvd Unit 1605
- 27120 Rose Rd
- 3222 Balsam Dr
- 2063 Columbia Rd
- 2820 N Bay Dr
- 25360 Hall Dr
- 2619 Jackie Ln Unit 7
- 2627 Jackie Ln Unit 5
- 2635 Jackie Ln
- 2639 Jackie Ln
- 2643 Jackie Ln
- 2623 Jackie Ln
- 2573 Jackie Ln Unit 24A
- 2555 Jackie Ln Unit 25A
- 2571 Jackie Ln Unit 22A
- 2553 Jackie Ln
- 2551 Jackie Ln
- 2575 Jackie Ln Unit 21A
- 2577 Jackie Ln
- 2577 Jackie Ln Unit 23A
- 2647 Kimberly Ln Unit 2A
- 2649 Kimberly Ln Unit 1A
- 2643 Kimberly Ln Unit 4A
- 2637 Kimberly Ln Unit 6A
- 2645 Kimberly Ln Unit 34
- 2641 Kimberly Ln