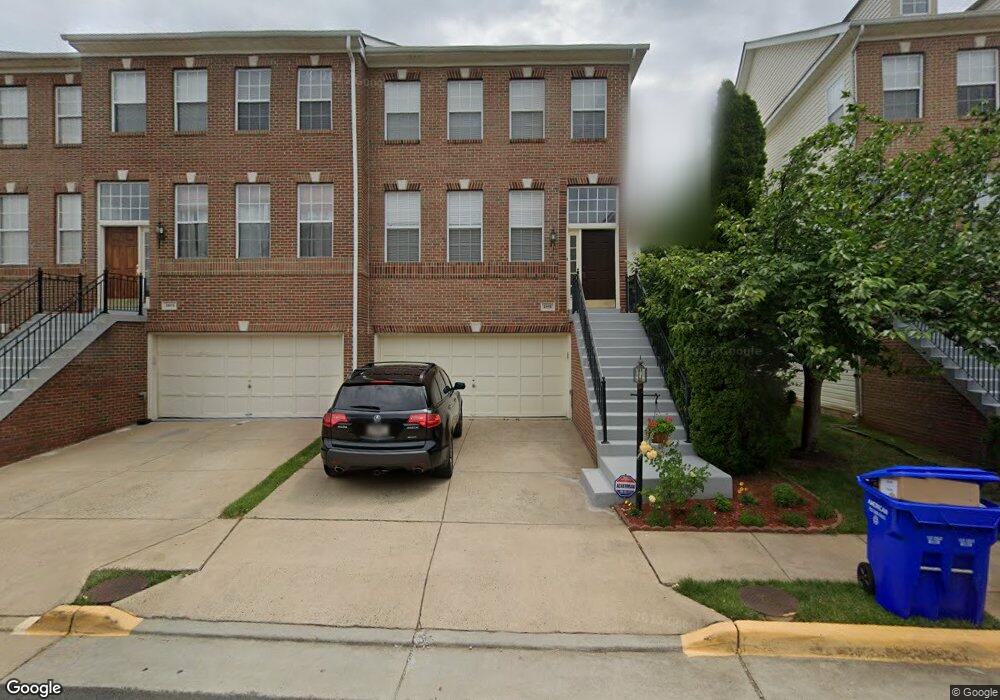
2615 Tarleton Corner Dr Herndon, VA 20171
Estimated Value: $681,418 - $739,000
3
Beds
4
Baths
1,822
Sq Ft
$392/Sq Ft
Est. Value
About This Home
This home is located at 2615 Tarleton Corner Dr, Herndon, VA 20171 and is currently estimated at $713,605, approximately $391 per square foot. 2615 Tarleton Corner Dr is a home located in Fairfax County with nearby schools including Mcnair Elementary School, McNair Upper Elementary School, and Rachel Carson Middle School.
Ownership History
Date
Name
Owned For
Owner Type
Purchase Details
Closed on
May 23, 2006
Sold by
Mannava Venkatramaiah
Bought by
Almeida Antony Bobby
Current Estimated Value
Home Financials for this Owner
Home Financials are based on the most recent Mortgage that was taken out on this home.
Original Mortgage
$367,500
Outstanding Balance
$214,419
Interest Rate
6.53%
Mortgage Type
New Conventional
Estimated Equity
$499,186
Purchase Details
Closed on
Jan 28, 2003
Sold by
Yushina Galina
Bought by
Mannava Venkatramaiah
Home Financials for this Owner
Home Financials are based on the most recent Mortgage that was taken out on this home.
Original Mortgage
$271,200
Interest Rate
6.11%
Mortgage Type
New Conventional
Purchase Details
Closed on
Nov 23, 1999
Sold by
Engle Homes/Va Inc
Bought by
Yushin Nikolay K
Home Financials for this Owner
Home Financials are based on the most recent Mortgage that was taken out on this home.
Original Mortgage
$203,350
Interest Rate
7.76%
Create a Home Valuation Report for This Property
The Home Valuation Report is an in-depth analysis detailing your home's value as well as a comparison with similar homes in the area
Home Values in the Area
Average Home Value in this Area
Purchase History
| Date | Buyer | Sale Price | Title Company |
|---|---|---|---|
| Almeida Antony Bobby | $525,000 | -- | |
| Mannava Venkatramaiah | $339,900 | -- | |
| Yushin Nikolay K | $215,407 | -- |
Source: Public Records
Mortgage History
| Date | Status | Borrower | Loan Amount |
|---|---|---|---|
| Open | Almeida Antony Bobby | $367,500 | |
| Previous Owner | Mannava Venkatramaiah | $271,200 | |
| Previous Owner | Yushin Nikolay K | $203,350 |
Source: Public Records
Tax History
| Year | Tax Paid | Tax Assessment Tax Assessment Total Assessment is a certain percentage of the fair market value that is determined by local assessors to be the total taxable value of land and additions on the property. | Land | Improvement |
|---|---|---|---|---|
| 2025 | $7,085 | $654,060 | $205,000 | $449,060 |
| 2024 | $7,085 | $611,560 | $190,000 | $421,560 |
| 2023 | $6,769 | $599,850 | $185,000 | $414,850 |
| 2022 | $6,623 | $579,160 | $175,000 | $404,160 |
| 2021 | $6,345 | $540,690 | $165,000 | $375,690 |
| 2020 | $5,733 | $484,380 | $125,000 | $359,380 |
| 2019 | $5,917 | $499,920 | $125,000 | $374,920 |
| 2018 | $5,587 | $485,790 | $115,000 | $370,790 |
| 2017 | $5,640 | $485,790 | $115,000 | $370,790 |
| 2016 | $5,628 | $485,790 | $115,000 | $370,790 |
Source: Public Records
Map
Nearby Homes
- 2542 James Monroe Cir
- 3499 Audubon Cove
- 3495 Audubon Cove
- 2406 Misty Dawn Ct
- 2603 Loganberry Dr
- 13695 Innovation Station Loop Unit 77B
- 2467 Cypress Green Ln
- 13673 Venturi Ln Unit 234
- 13656 Salk St Unit 139
- 13103 Anvil Place
- 13040 Cabin Creek Rd Unit 13040
- 2611 River Birch Rd
- 2605 River Birch Rd
- 2609 River Birch Rd
- 2615 River Birch Rd
- 2619 River Birch Rd
- 2617 River Birch Rd
- 2625 River Birch Rd
- 2601 River Birch Rd
- 2603 River Birch Rd
- 2613 Tarleton Corner Dr
- 2619 Tarleton Corner Dr
- 2611 Tarleton Corner Dr
- 2621 Tarleton Corner Dr
- 2609 Tarleton Corner Dr
- 2623 Tarleton Corner Dr
- 2602 Logan Wood Dr
- 2604 Logan Wood Dr
- 2607 Tarleton Corner Dr
- 2598 Logan Wood Dr
- 2625 Tarleton Corner Dr
- 2608 Logan Wood Dr
- 2596 Logan Wood Dr
- 2612 Tarleton Corner Dr
- 2614 Tarleton Corner Dr
- 2605 Tarleton Corner Dr
- 2616 Tarleton Corner Dr
- 2610 Tarleton Corner Dr
- 2610 Logan Wood Dr
- 2594 Logan Wood Dr
Your Personal Tour Guide
Ask me questions while you tour the home.