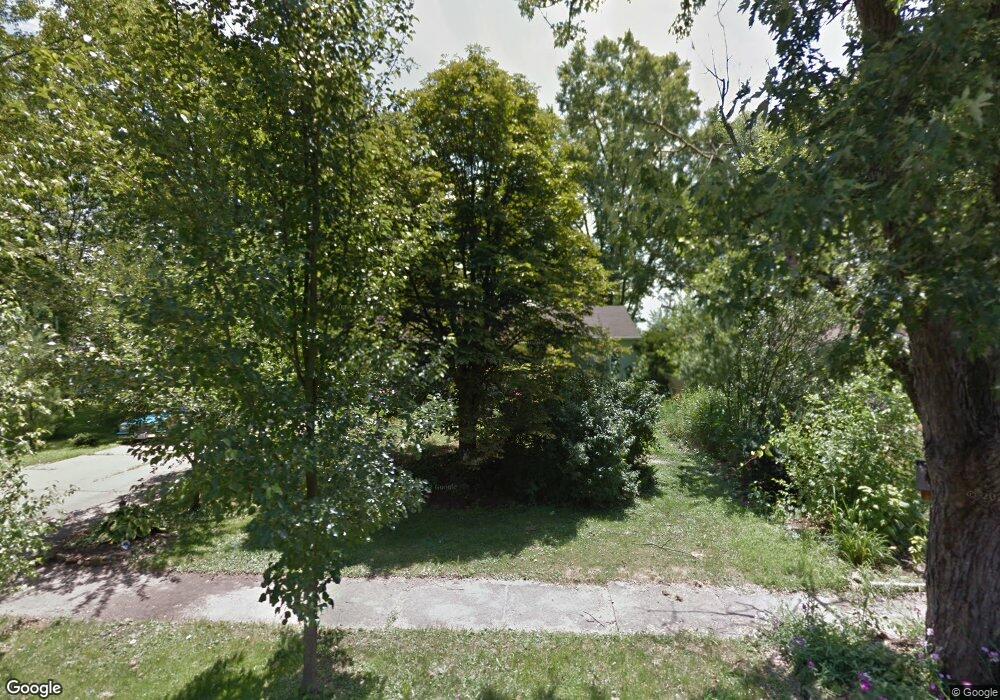
26159 Cranage Rd Olmsted Falls, OH 44138
Estimated Value: $179,000 - $249,000
3
Beds
1
Bath
864
Sq Ft
$243/Sq Ft
Est. Value
About This Home
This home is located at 26159 Cranage Rd, Olmsted Falls, OH 44138 and is currently estimated at $209,933, approximately $242 per square foot. 26159 Cranage Rd is a home located in Cuyahoga County with nearby schools including Falls-Lenox Primary Elementary School, Olmsted Falls Intermediate Building, and Olmsted Falls Middle School.
Ownership History
Date
Name
Owned For
Owner Type
Purchase Details
Closed on
Dec 19, 2000
Sold by
Rukowski Jacob T Fisher Lynn A and Fisher Lynn A
Bought by
Patrick Christopher and Patrick Cherie
Current Estimated Value
Home Financials for this Owner
Home Financials are based on the most recent Mortgage that was taken out on this home.
Original Mortgage
$119,600
Outstanding Balance
$44,486
Interest Rate
7.83%
Estimated Equity
$165,447
Purchase Details
Closed on
Aug 22, 1995
Sold by
Elias Marge
Bought by
Rutkowski Jacob T and Fisher Lynn A
Home Financials for this Owner
Home Financials are based on the most recent Mortgage that was taken out on this home.
Original Mortgage
$85,600
Interest Rate
7.64%
Mortgage Type
New Conventional
Purchase Details
Closed on
Dec 8, 1982
Sold by
Elias Geo E and Elias Marge
Bought by
Elias Marge
Purchase Details
Closed on
Jan 1, 1975
Bought by
Elias Geo E and Elias Marge
Create a Home Valuation Report for This Property
The Home Valuation Report is an in-depth analysis detailing your home's value as well as a comparison with similar homes in the area
Home Values in the Area
Average Home Value in this Area
Purchase History
| Date | Buyer | Sale Price | Title Company |
|---|---|---|---|
| Patrick Christopher | $125,900 | Midland Title Security Inc | |
| Rutkowski Jacob T | $107,000 | -- | |
| Elias Marge | -- | -- | |
| Elias Geo E | -- | -- |
Source: Public Records
Mortgage History
| Date | Status | Borrower | Loan Amount |
|---|---|---|---|
| Open | Patrick Christopher | $119,600 | |
| Closed | Rutkowski Jacob T | $85,600 |
Source: Public Records
Tax History Compared to Growth
Tax History
| Year | Tax Paid | Tax Assessment Tax Assessment Total Assessment is a certain percentage of the fair market value that is determined by local assessors to be the total taxable value of land and additions on the property. | Land | Improvement |
|---|---|---|---|---|
| 2024 | $4,290 | $55,615 | $14,315 | $41,300 |
| 2023 | $4,267 | $45,500 | $13,790 | $31,710 |
| 2022 | $4,233 | $45,500 | $13,790 | $31,710 |
| 2021 | $3,632 | $45,500 | $13,790 | $31,710 |
| 2020 | $3,556 | $39,940 | $12,110 | $27,830 |
| 2019 | $3,155 | $114,100 | $34,600 | $79,500 |
| 2018 | $3,400 | $39,940 | $12,110 | $27,830 |
| 2017 | $3,592 | $40,990 | $10,430 | $30,560 |
| 2016 | $3,573 | $40,990 | $10,430 | $30,560 |
| 2015 | $3,403 | $40,990 | $10,430 | $30,560 |
| 2014 | $3,403 | $37,940 | $9,660 | $28,280 |
Source: Public Records
Map
Nearby Homes
- 26179 Cranage Rd
- 7744 Mapleway Dr
- 7728 Mapleway Dr
- 26199 Cranage Rd
- 7752 Mapleway Dr
- 26180 Cranage Rd
- 26219 Cranage Rd
- 7714 Mapleway Dr
- 26239 Cranage Rd
- 7684 Mapleway Dr
- 26210 Cranage Rd
- 7683 Clark St
- 7683 Clark St
- 7683 Clark St
- 7683 Clark St
- 7741 Mapleway Dr
- 7751 Mapleway Dr
- 26259 Cranage Rd
- 7674 Mapleway Dr
- 7791 Mapleway Dr