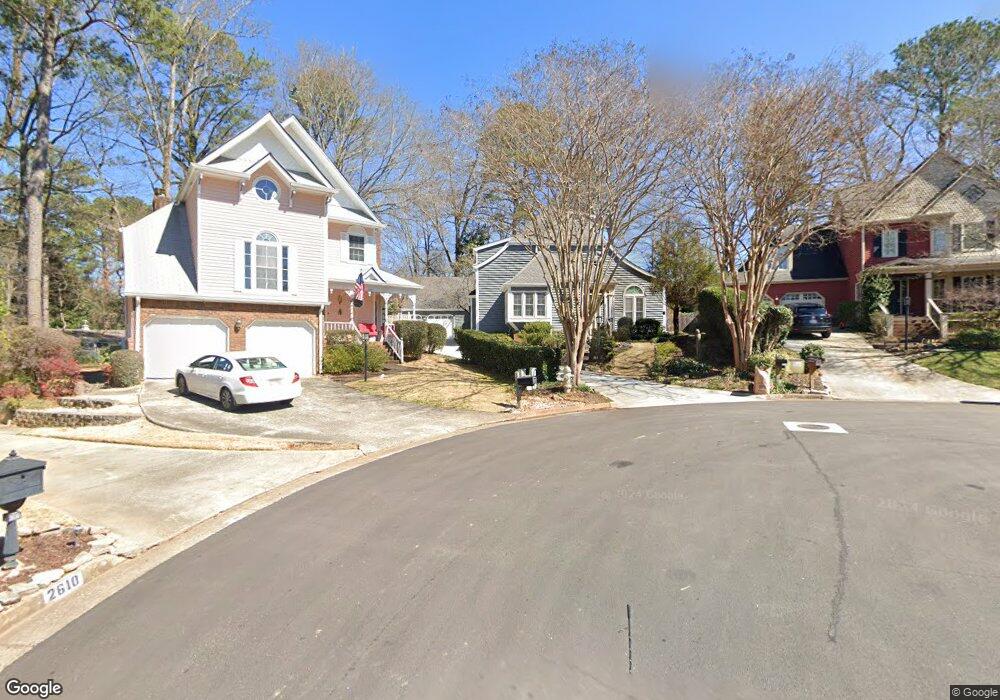
2616 Briers North Dr Unit 2 Atlanta, GA 30360
Estimated Value: $584,878 - $734,000
4
Beds
3
Baths
2,479
Sq Ft
$275/Sq Ft
Est. Value
About This Home
This home is located at 2616 Briers North Dr Unit 2, Atlanta, GA 30360 and is currently estimated at $680,970, approximately $274 per square foot. 2616 Briers North Dr Unit 2 is a home located in DeKalb County with nearby schools including Chesnut Elementary School, Peachtree Middle School, and Dunwoody High School.
Ownership History
Date
Name
Owned For
Owner Type
Purchase Details
Closed on
Aug 8, 2016
Sold by
Cheryl Lynn
Bought by
Jenkins Cheryl Lynn
Current Estimated Value
Purchase Details
Closed on
May 23, 2001
Sold by
Bosarge Michael H and Bosarge Tanya T
Bought by
Hagedorn Cheryl
Purchase Details
Closed on
Nov 27, 2000
Sold by
Peccarelli Louis A
Bought by
Bosarge Micheal H and Bosarge Tanya T
Home Financials for this Owner
Home Financials are based on the most recent Mortgage that was taken out on this home.
Original Mortgage
$279,000
Interest Rate
7.82%
Mortgage Type
New Conventional
Purchase Details
Closed on
Jul 15, 1994
Sold by
Monk John H Marian D
Bought by
Peccarelli Louis A
Home Financials for this Owner
Home Financials are based on the most recent Mortgage that was taken out on this home.
Original Mortgage
$163,200
Interest Rate
8.56%
Create a Home Valuation Report for This Property
The Home Valuation Report is an in-depth analysis detailing your home's value as well as a comparison with similar homes in the area
Home Values in the Area
Average Home Value in this Area
Purchase History
| Date | Buyer | Sale Price | Title Company |
|---|---|---|---|
| Jenkins Cheryl Lynn | -- | -- | |
| Jenkins Cheryl Lynn | -- | -- | |
| Hagedorn Cheryl | $310,000 | -- | |
| Bosarge Micheal H | $310,000 | -- | |
| Peccarelli Louis A | $204,000 | -- |
Source: Public Records
Mortgage History
| Date | Status | Borrower | Loan Amount |
|---|---|---|---|
| Previous Owner | Bosarge Micheal H | $279,000 | |
| Previous Owner | Peccarelli Louis A | $163,200 |
Source: Public Records
Tax History Compared to Growth
Tax History
| Year | Tax Paid | Tax Assessment Tax Assessment Total Assessment is a certain percentage of the fair market value that is determined by local assessors to be the total taxable value of land and additions on the property. | Land | Improvement |
|---|---|---|---|---|
| 2024 | $1,055 | $207,840 | $50,880 | $156,960 |
| 2023 | $1,055 | $206,440 | $50,880 | $155,560 |
| 2022 | $4,742 | $177,120 | $50,880 | $126,240 |
| 2021 | $4,480 | $163,360 | $50,880 | $112,480 |
| 2020 | $3,713 | $127,840 | $50,880 | $76,960 |
| 2019 | $3,969 | $140,480 | $50,880 | $89,600 |
| 2018 | $4,100 | $138,600 | $50,880 | $87,720 |
| 2017 | $4,481 | $140,280 | $40,720 | $99,560 |
| 2016 | $4,234 | $135,440 | $40,720 | $94,720 |
| 2014 | $3,709 | $115,320 | $40,720 | $74,600 |
Source: Public Records
Map
Nearby Homes
- 2611 Briers Dr N
- 4610 Brierwood Place
- 2551 Briers North Dr
- 2631 Holliston Ct
- 2597 E Madison Dr
- 2624 E Madison Dr
- 2600 Amberly Dr
- 2511 Cherry Hill Ln
- 2659 Amberly Dr Unit 18
- 4579 Amberly Ct S
- 2695 Peeler Rd
- 2484 Madison Commons
- 4567 Sharon Valley Ct Unit 12
- 4834 Tilly Mill Rd
- 4846 Twin Lakes Trail
- 2459 Chestnut Landing
- 4430 Tilly Mill Rd Unit 104
- 2614 Briers Dr N Unit 2
- 2614 Briers Dr N
- 2614 Briers North Dr
- 2617 Briers North Dr Unit 2
- 2617 Briers Dr N
- 4632 Stonehenge Dr
- 2610 Briers Dr N
- 2610 Briers North Dr
- 2619 Andover Dr
- 4640 Stonehenge Dr
- 2611 Andover Dr
- 2613 Briers North Dr
- 2606 Briers North Dr Unit 2
- 2611 Briers North Dr
- 4648 Stonehenge Dr
- 2609 Briers North Dr
- 4616 Stonehenge Dr
- 2600 Briers North Dr
- 2603 Andover Dr
- 0 Stonehenge Dr Unit 7434990