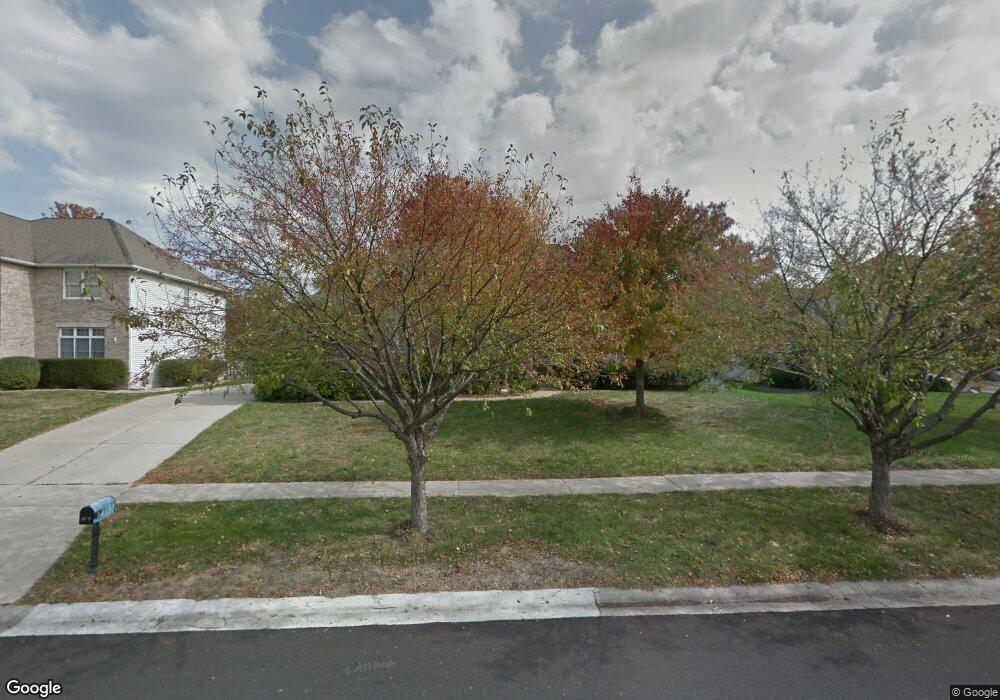
2616 Kipling Dr Springfield, IL 62711
Cobblestone Estates NeighborhoodEstimated Value: $445,369 - $608,000
4
Beds
4
Baths
3,250
Sq Ft
$154/Sq Ft
Est. Value
About This Home
This home is located at 2616 Kipling Dr, Springfield, IL 62711 and is currently estimated at $501,342, approximately $154 per square foot. 2616 Kipling Dr is a home located in Sangamon County with nearby schools including Lindsay School, Benjamin Franklin Middle School, and Springfield High School.
Ownership History
Date
Name
Owned For
Owner Type
Purchase Details
Closed on
Feb 22, 2012
Current Estimated Value
Purchase Details
Closed on
Nov 18, 2003
Purchase Details
Closed on
Nov 17, 2003
Purchase Details
Closed on
Oct 15, 2002
Purchase Details
Closed on
Feb 27, 1998
Purchase Details
Closed on
May 7, 1997
Create a Home Valuation Report for This Property
The Home Valuation Report is an in-depth analysis detailing your home's value as well as a comparison with similar homes in the area
Home Values in the Area
Average Home Value in this Area
Purchase History
| Date | Buyer | Sale Price | Title Company |
|---|---|---|---|
| -- | -- | -- | |
| -- | $322,500 | -- | |
| -- | -- | -- | |
| -- | $315,000 | -- | |
| -- | $295,000 | -- | |
| -- | $36,900 | -- |
Source: Public Records
Tax History
| Year | Tax Paid | Tax Assessment Tax Assessment Total Assessment is a certain percentage of the fair market value that is determined by local assessors to be the total taxable value of land and additions on the property. | Land | Improvement |
|---|---|---|---|---|
| 2024 | $11,278 | $142,285 | $22,784 | $119,501 |
| 2023 | $10,795 | $129,964 | $20,811 | $109,153 |
| 2022 | $10,352 | $123,282 | $19,741 | $103,541 |
| 2021 | $9,990 | $118,666 | $19,002 | $99,664 |
| 2020 | $9,792 | $118,845 | $19,031 | $99,814 |
| 2019 | $9,611 | $118,431 | $18,965 | $99,466 |
| 2018 | $9,313 | $117,854 | $18,873 | $98,981 |
| 2017 | $9,114 | $116,330 | $18,629 | $97,701 |
| 2016 | $8,929 | $114,633 | $18,357 | $96,276 |
| 2015 | $8,836 | $113,263 | $18,138 | $95,125 |
| 2014 | $8,735 | $112,532 | $18,021 | $94,511 |
| 2013 | $8,541 | $112,959 | $18,021 | $94,938 |
Source: Public Records
Map
Nearby Homes
- 3050 W Iles Ave
- 6013 Hedley Rd
- 5904 Hedley Rd
- 2934 Rainier Dr
- 2944 Rainier Dr
- 11B Westgate Dr
- 9A Westgate Dr
- 9B Westgate Dr
- 10B Westgate Dr
- 11A Westgate Dr
- 10A Westgate Dr
- 1719 Ambleside Dr
- 1717 Ambleside Dr
- 3702 Westgate Dr
- Lots 4-7 Yucan & Mercantile Dr
- 2312 Flaxen Mill Ct
- 2341 W White Oaks Dr
- 1914 Sun Mill Ct
- 4685 Wabash Ave
- 3200 Greenbriar Dr
- 2620 Kipling Dr
- 2612 Kipling Dr
- 2608 Kipling Dr
- 2624 Kipling Dr
- 2617 Kipling Dr
- 2621 Kipling Dr
- 2613 Kipling Dr
- 2625 Kipling Dr
- 2609 Kipling Dr
- 2604 Kipling Dr
- 3624 Fielding Dr
- 2605 Kipling Dr
- 3624 Ginger Creek Dr
- 3620 Ginger Creek Dr
- 2601 Kipling Dr
- 2701 Kipling Dr
- 2704 Kipling Dr
- 3616 Ginger Creek Dr
- 3704 Ginger Creek Dr
- 2705 Kipling Dr
Your Personal Tour Guide
Ask me questions while you tour the home.