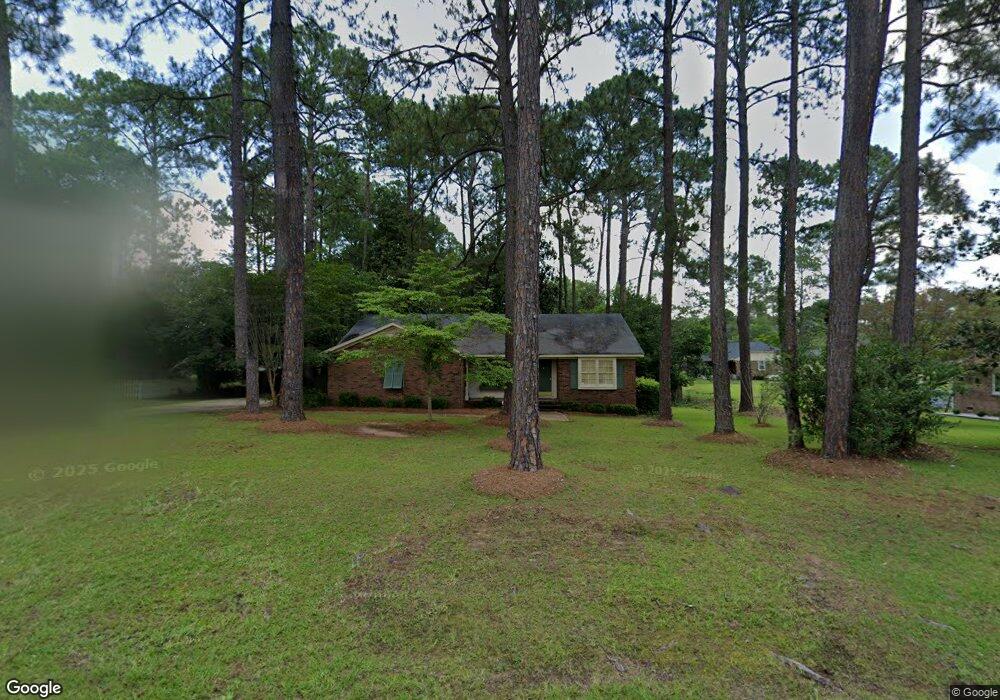
2616 Lansing Dr Albany, GA 31721
Estimated Value: $200,419 - $211,000
3
Beds
2
Baths
1,662
Sq Ft
$124/Sq Ft
Est. Value
About This Home
This home is located at 2616 Lansing Dr, Albany, GA 31721 and is currently estimated at $205,355, approximately $123 per square foot. 2616 Lansing Dr is a home located in Dougherty County with nearby schools including Live Oak Elementary School, Merry Acres Middle School, and Westover High School.
Ownership History
Date
Name
Owned For
Owner Type
Purchase Details
Closed on
Jun 28, 2017
Sold by
Beck Melody M
Bought by
Mooney Michael Neil
Current Estimated Value
Purchase Details
Closed on
Oct 26, 2011
Sold by
Beck Melody Martin
Bought by
Beck Melody M
Home Financials for this Owner
Home Financials are based on the most recent Mortgage that was taken out on this home.
Original Mortgage
$50,000
Interest Rate
4.16%
Mortgage Type
New Conventional
Purchase Details
Closed on
Mar 28, 1997
Sold by
Campbell Robert M and Campbell Lisa W
Bought by
Jenkins Melody Martin
Purchase Details
Closed on
Nov 19, 1993
Sold by
Campbell Robert M
Bought by
Campbell Lisa W
Purchase Details
Closed on
Jun 21, 1991
Sold by
Amsouth Mtge Co
Bought by
Veteran'S Affairs
Purchase Details
Closed on
Dec 13, 1983
Sold by
Mitchell Charles F
Bought by
Jennings James and Jennings Ma
Create a Home Valuation Report for This Property
The Home Valuation Report is an in-depth analysis detailing your home's value as well as a comparison with similar homes in the area
Home Values in the Area
Average Home Value in this Area
Purchase History
| Date | Buyer | Sale Price | Title Company |
|---|---|---|---|
| Mooney Michael Neil | $118,000 | -- | |
| Beck Melody M | -- | -- | |
| Jenkins Melody Martin | $86,200 | -- | |
| Campbell Lisa W | -- | -- | |
| Veteran'S Affairs | -- | -- | |
| Jennings James | -- | -- |
Source: Public Records
Mortgage History
| Date | Status | Borrower | Loan Amount |
|---|---|---|---|
| Previous Owner | Beck Melody M | $50,000 |
Source: Public Records
Tax History Compared to Growth
Tax History
| Year | Tax Paid | Tax Assessment Tax Assessment Total Assessment is a certain percentage of the fair market value that is determined by local assessors to be the total taxable value of land and additions on the property. | Land | Improvement |
|---|---|---|---|---|
| 2024 | $2,254 | $47,240 | $8,440 | $38,800 |
| 2023 | $2,201 | $47,240 | $8,440 | $38,800 |
| 2022 | $2,209 | $47,240 | $8,440 | $38,800 |
| 2021 | $2,048 | $47,240 | $8,440 | $38,800 |
| 2020 | $2,053 | $47,240 | $8,440 | $38,800 |
| 2019 | $2,061 | $47,240 | $8,440 | $38,800 |
| 2018 | $2,068 | $47,240 | $8,440 | $38,800 |
| 2017 | $1,928 | $47,240 | $8,440 | $38,800 |
| 2016 | $1,929 | $47,240 | $8,440 | $38,800 |
| 2015 | $1,934 | $47,240 | $8,440 | $38,800 |
| 2014 | $1,910 | $47,240 | $8,440 | $38,800 |
Source: Public Records
Map
Nearby Homes
- 2600 Shannon Rd
- 2530 E Alberson Dr
- 2732 Dover Ln
- 3101 Old Dawson Rd
- 2511 Wexford Dr
- 3203 Wexford Dr
- 2509 E Alberson Dr
- 3424 Bellingham Ln
- 2303 Saddlebrook Ct
- 2532 E Alberson Dr
- 2423 E Alberson Dr
- 2713 Westmeade Rd
- 2421 E Alberson Dr
- 2504 W Alberson Dr
- 127 Cambridge Rd
- 2207 Vineyard Ct
- 2600 E Doublegate Dr
- 2707 Somerset Dr
- 2829 N Doublegate Dr
- N/A N Doublegate Dr
- 2618 Lansing Dr
- 2614 Lansing Dr
- 3311 Shannon Rd
- 3308 Forest Ridge Dr
- 2617 Lansing Dr
- 2620 Lansing Dr
- 2615 Lansing Dr
- 3309 Shannon Rd
- 2619 Lansing Dr
- 2610 Lansing Dr
- 3310 Forest Ridge Dr
- 2613 Lansing Dr
- 3306 Forest Ridge Dr
- 3307 Shannon Rd
- 2621 Lansing Dr
- 3310 Shannon Rd
- 2611 Lansing Dr
- 2608 Lansing Dr
- 3304 Forest Ridge Dr
- 3308 Shannon Rd