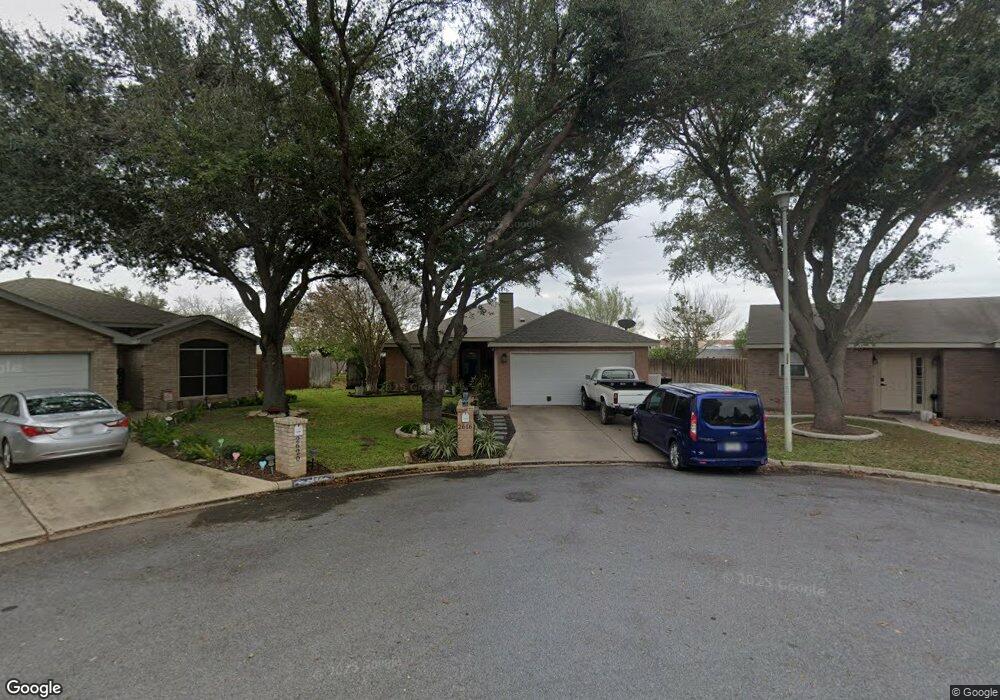
2616 N 41st St McAllen, TX 78501
Estimated Value: $203,000 - $248,383
3
Beds
3
Baths
1,263
Sq Ft
$176/Sq Ft
Est. Value
About This Home
This home is located at 2616 N 41st St, McAllen, TX 78501 and is currently estimated at $222,846, approximately $176 per square foot. 2616 N 41st St is a home located in Hidalgo County with nearby schools including McAuliffe Elementary School, Michael E. Fossum Middle School, and Rowe High School.
Ownership History
Date
Name
Owned For
Owner Type
Purchase Details
Closed on
Jun 11, 2012
Sold by
Vera Mayra Deyanira
Bought by
Quiroz Danny Joe and Quiroz Michelle
Current Estimated Value
Home Financials for this Owner
Home Financials are based on the most recent Mortgage that was taken out on this home.
Original Mortgage
$99,000
Outstanding Balance
$14,707
Interest Rate
3.86%
Mortgage Type
New Conventional
Estimated Equity
$208,139
Purchase Details
Closed on
Jul 30, 2007
Sold by
Garcia Jose G
Bought by
Carreno Oscar and Vera Deyanira
Home Financials for this Owner
Home Financials are based on the most recent Mortgage that was taken out on this home.
Original Mortgage
$86,250
Interest Rate
6.73%
Mortgage Type
Purchase Money Mortgage
Purchase Details
Closed on
Jul 27, 2007
Sold by
Garcia Marisol and Martinez Marisol
Bought by
Garcia Jose G
Home Financials for this Owner
Home Financials are based on the most recent Mortgage that was taken out on this home.
Original Mortgage
$86,250
Interest Rate
6.73%
Mortgage Type
Purchase Money Mortgage
Create a Home Valuation Report for This Property
The Home Valuation Report is an in-depth analysis detailing your home's value as well as a comparison with similar homes in the area
Home Values in the Area
Average Home Value in this Area
Purchase History
| Date | Buyer | Sale Price | Title Company |
|---|---|---|---|
| Quiroz Danny Joe | -- | Sierra Title | |
| Carreno Oscar | -- | Sierra Title | |
| Garcia Jose G | -- | Sierra Title |
Source: Public Records
Mortgage History
| Date | Status | Borrower | Loan Amount |
|---|---|---|---|
| Open | Quiroz Danny Joe | $99,000 | |
| Previous Owner | Carreno Oscar | $86,250 |
Source: Public Records
Tax History Compared to Growth
Tax History
| Year | Tax Paid | Tax Assessment Tax Assessment Total Assessment is a certain percentage of the fair market value that is determined by local assessors to be the total taxable value of land and additions on the property. | Land | Improvement |
|---|---|---|---|---|
| 2025 | $2,965 | $185,929 | -- | -- |
| 2024 | $2,965 | $169,026 | -- | -- |
| 2023 | $3,615 | $153,660 | $0 | $0 |
| 2022 | $3,464 | $139,691 | $0 | $0 |
| 2021 | $3,244 | $126,992 | $38,962 | $88,030 |
| 2020 | $3,061 | $119,975 | $38,962 | $81,013 |
| 2019 | $2,899 | $114,284 | $38,962 | $75,322 |
| 2018 | $2,907 | $114,422 | $38,150 | $76,272 |
| 2017 | $2,943 | $115,372 | $38,150 | $77,222 |
| 2016 | $2,991 | $117,269 | $38,150 | $79,119 |
| 2015 | $2,633 | $112,366 | $36,243 | $76,123 |
Source: Public Records
Map
Nearby Homes
- 3920 Highland Ave
- 3929 Highland Ave
- 3925 Highland Ave
- 3917 Highland Ave
- 3904 Westway Ave
- 3908 Westway Ave
- 3913 Westway Ave
- 3713 Westway Ave
- 3811 Westway Ct
- 3710 Westway Ct
- 4125 Harvey Cir
- Magnolia Plan at Harvest Coves
- Juniper Plan at Harvest Coves
- Jasmine Plan at Harvest Coves
- Iris Plan at Harvest Coves
- Encino Plan at Harvest Coves
- Paloma Plan at Harvest Coves
- Bahia Plan at Harvest Coves
- Marigold Plan at Harvest Coves
- San Luis Plan at Harvest Coves
- 4101 Whitewing Ave
- 2617 N 40th St
- 2621 N 40th St
- 4105 Whitewing Ave
- 2700 N 41st St
- 2625 N 40th St
- 4109 Whitewing Ave Unit 74
- 2704 N 41st St
- 2704 N 41st St Unit 80
- 2701 N 40th St
- 4100 Whitewing Ave
- 4100 Whitewing Ave
- 4113 Whitewing Ave
- 2705 N 40th St
- 2708 N 41st St
- 4104 Whitewing Ave
- 3913 Whitewing Ave
- 4108 Whitewing Ave
- 2709 N 40th St
- 2709 N 41st St