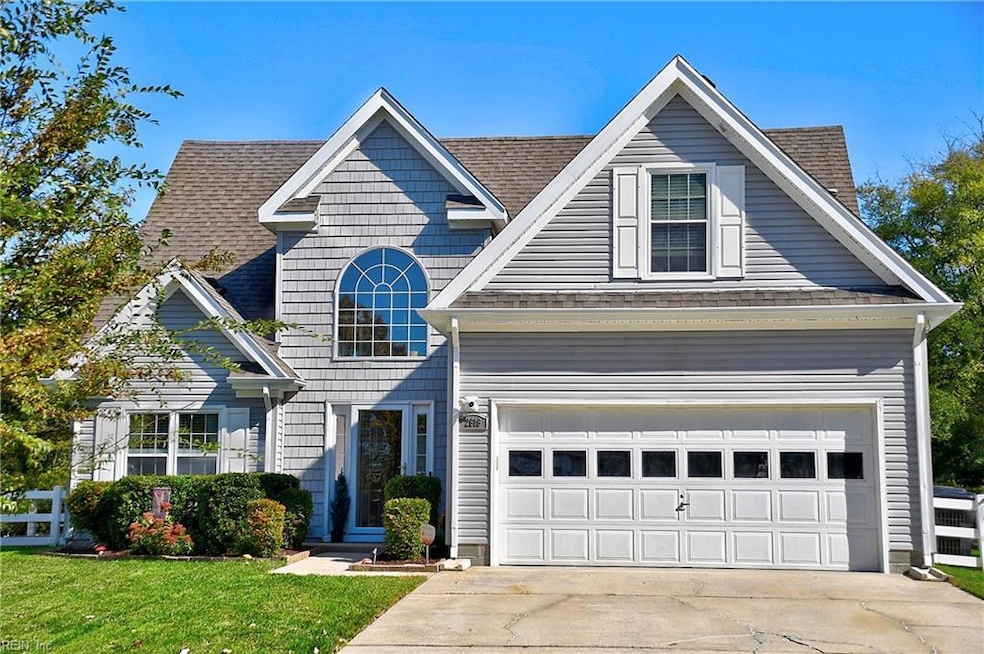
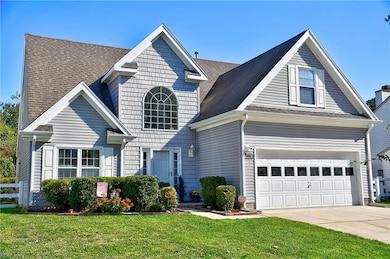
2616 Pulaski Loop Virginia Beach, VA 23456
Princess Anne NeighborhoodEstimated payment $3,299/month
Highlights
- Contemporary Architecture
- Main Floor Primary Bedroom
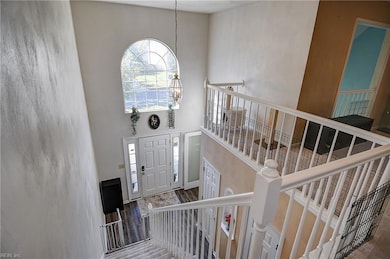
- Loft
- North Landing Elementary School Rated A
- Attic
- Patio
About This Home
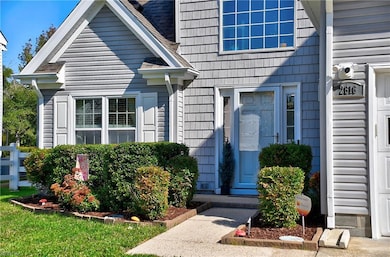
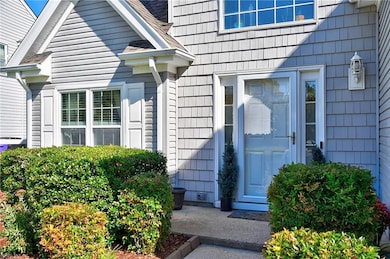
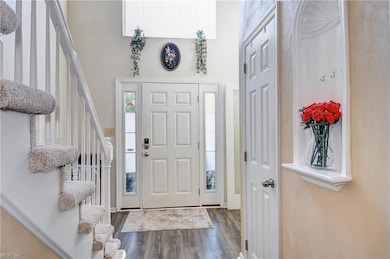
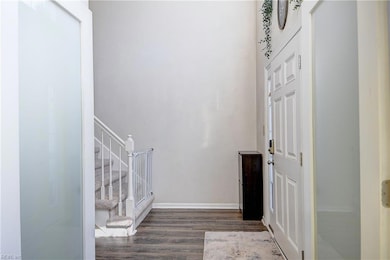
Move-in ready gem in the highly sought-after Courthouse Estates neighborhood! This beautifully maintained single-family home features a thoughtfully updated kitchen with modern appliances, and a cozy gas fireplace ready for those upcoming cooler evenings. The spacious first-floor primary suite boasts high ceilings and an elegantly renovated bathroom with a walk-in shower and built-in bench for added luxury. Enjoy soaring high ceilings, an open loft area, and great natural light throughout. Step outside to a newly installed covered patio with built in fans—creating an elevated space for relaxing or entertaining. Additional upgrades include epoxied garage floors and newer appliances. Conveniently located near shopping, dining, the amphitheater, and military bases. Don’t miss this opportunity to live in one of the area’s most desirable communities!
Home Details
Home Type
- Single Family
Est. Annual Taxes
- $4,337
Year Built
- Built in 1995
Lot Details
- Back Yard Fenced
- Property is zoned PDH1
HOA Fees
- $65 Monthly HOA Fees
Home Design
- Contemporary Architecture
- Slab Foundation
- Asphalt Shingled Roof
- Vinyl Siding
Interior Spaces
- 1,826 Sq Ft Home
- 2-Story Property
- Gas Fireplace
- Window Treatments
- Loft
- Utility Room
- Attic
Kitchen
- Electric Range
- Microwave
- Dishwasher
- Disposal
Flooring
- Carpet
- Laminate
Bedrooms and Bathrooms
- 3 Bedrooms
- Primary Bedroom on Main
- En-Suite Primary Bedroom
- Dual Vanity Sinks in Primary Bathroom
Laundry
- Dryer
- Washer
Parking
- 2 Car Attached Garage
- Driveway
Outdoor Features
- Patio
Schools
- North Landing Elementary School
- Landstown Middle School
- Kellam High School
Utilities
- Central Air
- Heat Pump System
- Electric Water Heater
Community Details
- Courthouse Estates 484 Subdivision
Map
Home Values in the Area
Average Home Value in this Area
Tax History
| Year | Tax Paid | Tax Assessment Tax Assessment Total Assessment is a certain percentage of the fair market value that is determined by local assessors to be the total taxable value of land and additions on the property. | Land | Improvement |
|---|---|---|---|---|
| 2025 | $4,337 | $462,100 | $205,000 | $257,100 |
| 2024 | $4,337 | $447,100 | $192,000 | $255,100 |
| 2023 | $4,151 | $419,300 | $175,000 | $244,300 |
| 2022 | $3,451 | $348,600 | $140,000 | $208,600 |
| 2021 | $3,015 | $304,500 | $120,000 | $184,500 |
| 2020 | $2,960 | $290,900 | $120,000 | $170,900 |
| 2019 | $2,897 | $275,800 | $120,000 | $155,800 |
| 2018 | $2,765 | $275,800 | $120,000 | $155,800 |
| 2017 | $2,705 | $269,800 | $120,000 | $149,800 |
| 2016 | $2,634 | $266,100 | $118,800 | $147,300 |
| 2015 | $2,634 | $266,100 | $118,800 | $147,300 |
| 2014 | $2,265 | $266,800 | $125,000 | $141,800 |
Property History
| Date | Event | Price | List to Sale | Price per Sq Ft |
|---|---|---|---|---|
| 10/23/2025 10/23/25 | For Sale | $545,000 | -- | $298 / Sq Ft |
Purchase History
| Date | Type | Sale Price | Title Company |
|---|---|---|---|
| Bargain Sale Deed | $463,000 | Fidelity National Title | |
| Deed | $216,000 | -- | |
| Deed | $157,000 | -- |
Mortgage History
| Date | Status | Loan Amount | Loan Type |
|---|---|---|---|
| Open | $454,613 | FHA | |
| Previous Owner | $147,000 | New Conventional | |
| Previous Owner | $157,000 | No Value Available |
Source: Real Estate Information Network (REIN)
MLS Number: 10607100
APN: 1493-37-3779
Disclaimer: Certain information contained herein is derived from information provided by parties other than Homes.com. All information provided is deemed reliable, but is not guaranteed to be accurate and should be independently verified.
![]() The listings data displayed on this medium comes in part from the Real Estate Information Network, Inc. (REIN) and has been authorized by participating listing Broker Members of REIN for display. REIN's listings are based upon Data submitted by its Broker Members, and REIN therefore makes no representation or warranty regarding the accuracy of the Data. All users of REIN's listings database should confirm the accuracy of the listing information directly with the listing agent.
The listings data displayed on this medium comes in part from the Real Estate Information Network, Inc. (REIN) and has been authorized by participating listing Broker Members of REIN for display. REIN's listings are based upon Data submitted by its Broker Members, and REIN therefore makes no representation or warranty regarding the accuracy of the Data. All users of REIN's listings database should confirm the accuracy of the listing information directly with the listing agent.
Copyright 2025 REIN. REIN's listings Data and information is protected under federal copyright laws. Federal law prohibits, among other acts, the unauthorized copying or alteration of, or preparation of derivative works from, all or any part of copyrighted materials, including certain compilations of Data and information. COPYRIGHT VIOLATORS MAY BE SUBJECT TO SEVERE FINES AND PENALTIES UNDER FEDERAL LAW.
REIN updates its listings on a daily basis.
Some listings may be duplicated in the search results due to the co-mingling of listings from more than one multiple listing service. Should there be different listing information between the duplicated listings; user is advised to verify the accuracy of the listing information before making any financial decisions.
Some or all of the listings (or listings Data) represented in this application have been enhanced with Data not provided by REIN. The enhancements are as follows: mapping, demographics, and economics. The source of these enhancements are: GreatSchools, CoStar, Google, Walk Score, How Loud, Collateral Analytics, Black Knight, First American, and Quantarium.
This application does not include information on all of the properties available for sale at this time.
- 2677 Alamance Cir
- 2632 Einstein Dr
- 3984 N Landing Rd
- 3024 Beaden Dr
- 3125 Sacramento Dr
- 3260 Sacramento Dr
- 2808 Kern Ct
- 2824 N Landing Rd
- 2937 Einstein Dr
- 2729 Alameda Dr
- 2701 Bach Ln
- 2436 Rockwater Cir
- 2809 Garland Atwater Jr Ct
- 2429 Guardhouse Way
- 2544 Bombay Landing
- 3121 Guardhouse Cir
- 2749 Browning Dr
- 2811 Loveliness Ct
- 2825 Loveliness Ct
- 5+ac Indian River Rd
- 2621 Alleghany Loop
- 3017 Polk Dr
- 2608 Wilkes Dr
- 3221 Barbour Dr
- 3216 Fayette Dr
- 2405 Guardhouse Way
- 2820 Majestic Oak Ct
- 2520 Allie Nicole Cir
- 3645 Landstown Rd
- 2627 Hartley St
- 3217 Crocus Ln
- 2601 Springhaven Dr
- 2665 Springhaven Dr
- 2892 Saville Garden Way
- 3481 Landstown Ct
- 1813 Laurel Oak Ln
- 3908 Winwick Way
- 3908 Kiwanis Ct
- 1900 Rip Rap Ct
- 2102 Verona Quay
