Estimated Value: $317,778 - $330,000
3
Beds
2
Baths
1,841
Sq Ft
$176/Sq Ft
Est. Value
About This Home
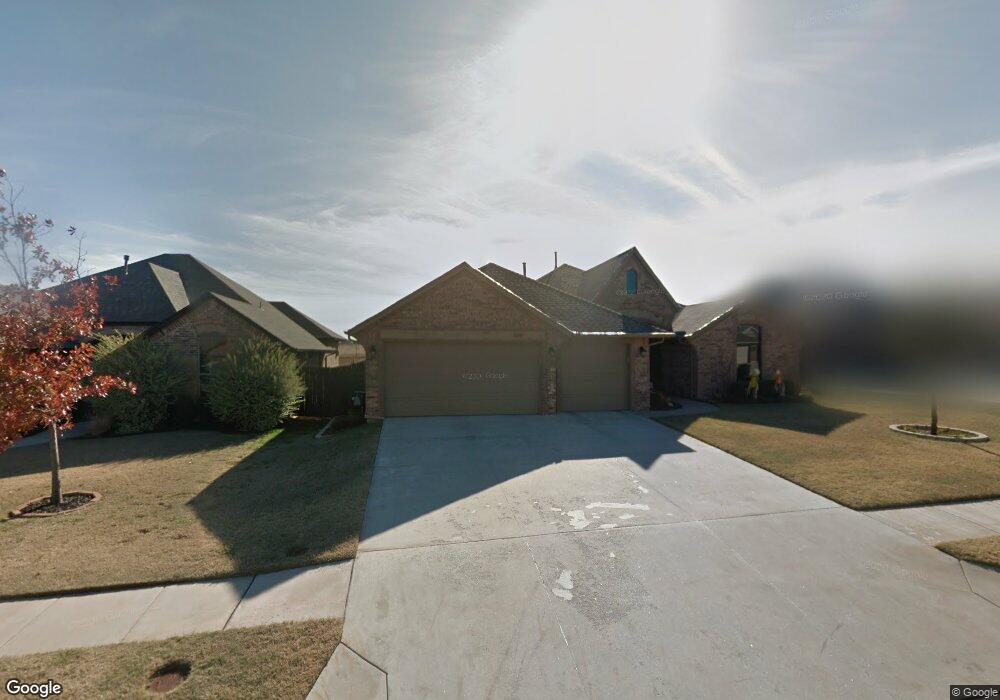
This home is located at 2616 SE 39th St, Moore, OK 73160 and is currently estimated at $323,695, approximately $175 per square foot. 2616 SE 39th St is a home located in Cleveland County with nearby schools including Timber Creek Elementary School, Highland East Junior High School, and Moore High School.
Ownership History
Date
Name
Owned For
Owner Type
Purchase Details
Closed on
Dec 11, 2009
Sold by
Haworth Homes Llc
Bought by
Wade Michael B and Wade Donna T
Current Estimated Value
Home Financials for this Owner
Home Financials are based on the most recent Mortgage that was taken out on this home.
Original Mortgage
$218,514
Outstanding Balance
$143,693
Interest Rate
5.06%
Mortgage Type
VA
Estimated Equity
$180,002
Purchase Details
Closed on
Jul 1, 2009
Sold by
Gt Development Llc
Bought by
Haworth Homes Llc
Home Financials for this Owner
Home Financials are based on the most recent Mortgage that was taken out on this home.
Original Mortgage
$168,000
Interest Rate
4.84%
Mortgage Type
Construction
Create a Home Valuation Report for This Property
The Home Valuation Report is an in-depth analysis detailing your home's value as well as a comparison with similar homes in the area
Home Values in the Area
Average Home Value in this Area
Purchase History
| Date | Buyer | Sale Price | Title Company |
|---|---|---|---|
| Wade Michael B | $214,000 | None Available | |
| Haworth Homes Llc | $37,500 | Fa |
Source: Public Records
Mortgage History
| Date | Status | Borrower | Loan Amount |
|---|---|---|---|
| Open | Wade Michael B | $218,514 | |
| Previous Owner | Haworth Homes Llc | $168,000 |
Source: Public Records
Tax History Compared to Growth
Tax History
| Year | Tax Paid | Tax Assessment Tax Assessment Total Assessment is a certain percentage of the fair market value that is determined by local assessors to be the total taxable value of land and additions on the property. | Land | Improvement |
|---|---|---|---|---|
| 2024 | -- | $27,461 | $4,604 | $22,857 |
| 2023 | $0 | $26,661 | $4,494 | $22,167 |
| 2022 | $0 | $25,884 | $4,132 | $21,752 |
| 2021 | $0 | $25,130 | $4,528 | $20,602 |
| 2020 | $2,889 | $24,399 | $4,536 | $19,863 |
| 2019 | $2,889 | $23,688 | $4,320 | $19,368 |
| 2018 | $0 | $23,688 | $4,320 | $19,368 |
| 2017 | $2,889 | $23,688 | $0 | $0 |
| 2016 | $2,909 | $23,688 | $4,320 | $19,368 |
| 2015 | $2,796 | $25,099 | $4,320 | $20,779 |
| 2014 | $2,862 | $25,099 | $4,320 | $20,779 |
Source: Public Records
Map
Nearby Homes
- 2600 SE 39th St
- 3508 Stratford Place
- 119 Armstrong Ct Unit Lot 1
- 116 Armstrong Ct Unit Lot 10
- 138 Armstrong Ct Unit Lot 9
- 3205 Caleb Ct
- Willow Creek Plan at Riverview Estates
- Seattle Plan at Riverview Estates
- Jordan Plan at Azalea Farms
- Jackson Plan at Azalea Farms
- Houston Plan at Azalea Farms
- Houston Plan at Cedar Hill Farms
- Galatians Plan at St. James Park
- Eden Plan at Azalea Farms
- Canyon Lane Plan at Riverview Estates
- Bethel Plan at Azalea Farms
- Baltimore Plan at Azalea Farms
- Frisco Plan at Azalea Farms
- Zion Plan at Azalea Farms
- Madison Plan at Azalea Farms
- 2612 SE 39th St
- 2620 SE 39th St
- 2624 SE 39th St
- 2608 SE 39th St
- 2604 SE 39th St
- 2628 SE 39th St
- 2613 SE 39th St
- 2617 SE 39th St
- 2621 SE 39th St
- 2609 SE 39th St
- 2625 SE 39th St
- 2605 SE 39th St
- 2516 SE 39th St
- 2632 SE 39th St
- 2601 SE 39th St
- 2629 SE 39th St
- 2633 SE 39th St
- 2616 SE 38th St
- 2624 SE 38th St
- 2620 SE 38th St