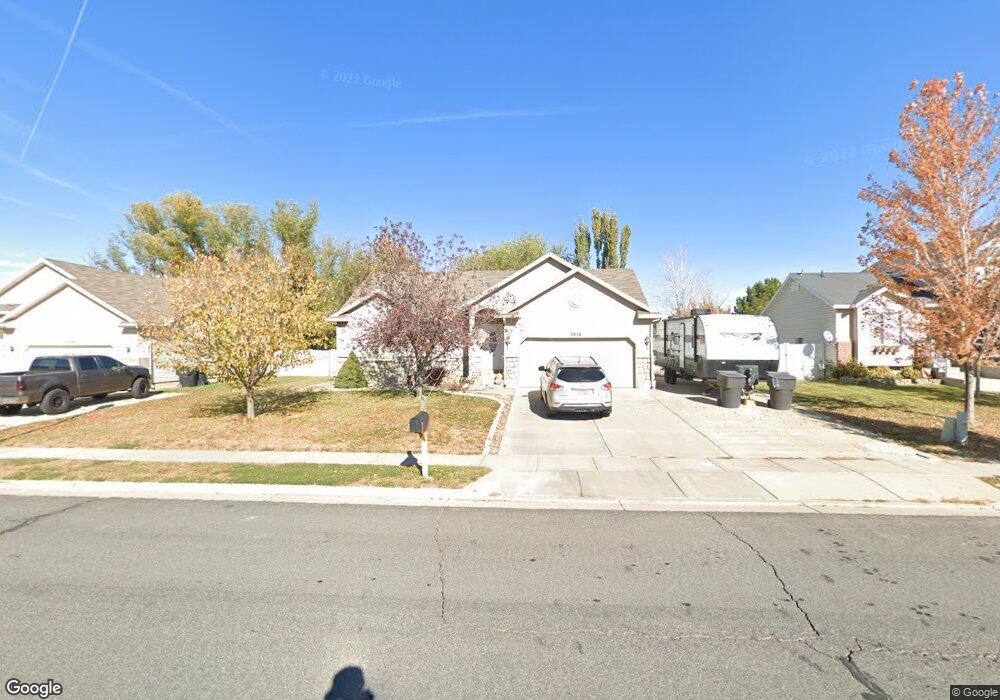
2616 W 1445 N Clearfield, UT 84015
Estimated Value: $475,983 - $505,000
2
Beds
2
Baths
2,365
Sq Ft
$206/Sq Ft
Est. Value
About This Home
This home is located at 2616 W 1445 N, Clearfield, UT 84015 and is currently estimated at $488,246, approximately $206 per square foot. 2616 W 1445 N is a home located in Davis County with nearby schools including West Clinton Elementary School, West Point Junior High School, and Syracuse High School.
Ownership History
Date
Name
Owned For
Owner Type
Purchase Details
Closed on
Mar 6, 2013
Sold by
Cook Troy
Bought by
American Homes 4 Rent Properties Three L
Current Estimated Value
Purchase Details
Closed on
Feb 27, 2013
Sold by
Cook Vanessa M
Bought by
Cook Troy
Purchase Details
Closed on
Dec 3, 2010
Sold by
Cook Troy
Bought by
Cook Troy and Cook Vanessa M
Purchase Details
Closed on
May 13, 2009
Sold by
Taylor Michael B
Bought by
Cook Troy
Home Financials for this Owner
Home Financials are based on the most recent Mortgage that was taken out on this home.
Original Mortgage
$185,000
Interest Rate
4.71%
Mortgage Type
VA
Purchase Details
Closed on
Sep 16, 2004
Sold by
North Ivory
Bought by
Taylor Michael B
Home Financials for this Owner
Home Financials are based on the most recent Mortgage that was taken out on this home.
Original Mortgage
$146,463
Interest Rate
5.94%
Mortgage Type
FHA
Create a Home Valuation Report for This Property
The Home Valuation Report is an in-depth analysis detailing your home's value as well as a comparison with similar homes in the area
Home Values in the Area
Average Home Value in this Area
Purchase History
| Date | Buyer | Sale Price | Title Company |
|---|---|---|---|
| American Homes 4 Rent Properties Three L | -- | West Title Co | |
| Cook Troy | -- | Title West Title Co | |
| Cook Troy | -- | Us Title Company Of Utah | |
| Cook Troy | -- | Us Title Company Of Ut | |
| Taylor Michael B | -- | Bonneville Title Company Inc | |
| North Ivory | -- | Bonneville Title Company Inc |
Source: Public Records
Mortgage History
| Date | Status | Borrower | Loan Amount |
|---|---|---|---|
| Previous Owner | Cook Troy | $185,000 | |
| Previous Owner | Taylor Michael B | $146,463 | |
| Closed | Taylor Michael B | $8,787 |
Source: Public Records
Tax History Compared to Growth
Tax History
| Year | Tax Paid | Tax Assessment Tax Assessment Total Assessment is a certain percentage of the fair market value that is determined by local assessors to be the total taxable value of land and additions on the property. | Land | Improvement |
|---|---|---|---|---|
| 2025 | $2,688 | $258,500 | $93,812 | $164,688 |
| 2024 | $2,583 | $249,699 | $102,757 | $146,942 |
| 2023 | $2,432 | $239,250 | $64,650 | $174,599 |
| 2022 | $2,585 | $465,000 | $129,328 | $335,672 |
| 2021 | $2,317 | $340,000 | $90,356 | $249,644 |
| 2020 | $2,017 | $293,000 | $77,478 | $215,522 |
| 2019 | $1,966 | $279,000 | $89,243 | $189,757 |
| 2018 | $1,851 | $258,000 | $75,210 | $182,790 |
| 2016 | $1,648 | $118,635 | $29,433 | $89,202 |
| 2015 | $1,627 | $111,375 | $29,433 | $81,942 |
| 2014 | $1,609 | $111,859 | $29,433 | $82,426 |
| 2013 | -- | $98,657 | $27,143 | $71,514 |
Source: Public Records
Map
Nearby Homes