
Landlord's Agent in 2023
Nicole Sturm
@properties
(765) 335-5588
1 in this area
2 Total Sales

Estimated Value: $264,000 - $277,000
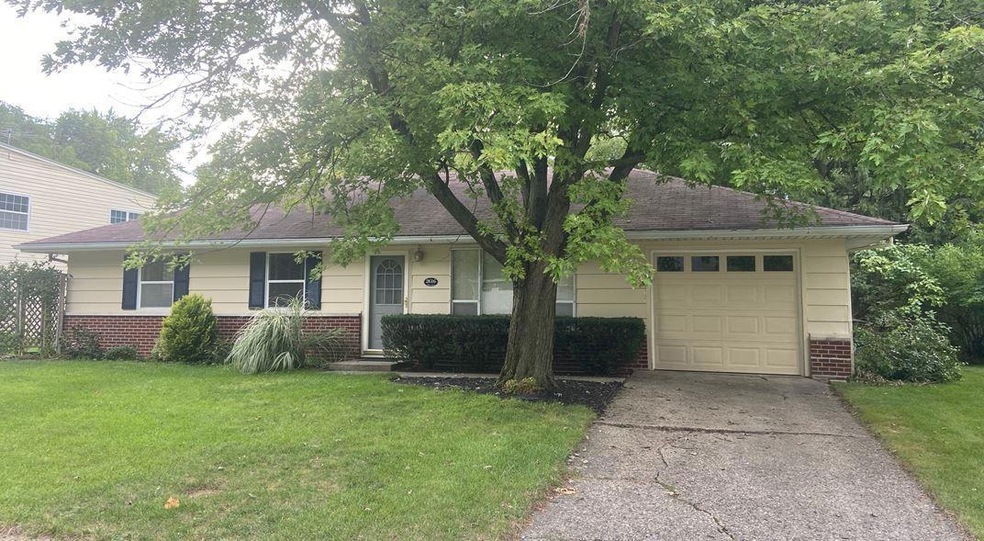
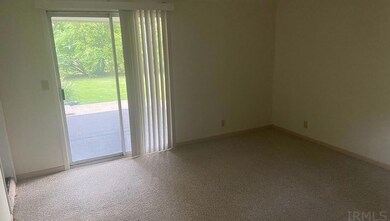
Beautifully maintained home. 2 living areas. Large yard. Attached garage.
| Date | Buyer | Sale Price | Title Company |
|---|---|---|---|
| Hirleman Edwin Daniel | -- | None Listed On Document | |
| Jones Paul J | -- | -- |
| Date | Status | Borrower | Loan Amount |
|---|---|---|---|
| Previous Owner | Jones Paul J | $77,600 |
| Date | Event | Price | List to Sale | Price per Sq Ft | Prior Sale |
|---|---|---|---|---|---|
| 04/01/2023 04/01/23 | Rented | $1,675 | +1.5% | -- | |
| 03/15/2023 03/15/23 | Price Changed | $1,650 | -2.9% | $1 / Sq Ft | |
| 01/12/2023 01/12/23 | Price Changed | $1,700 | -10.5% | $1 / Sq Ft | |
| 09/30/2022 09/30/22 | Price Changed | $1,900 | -9.5% | $1 / Sq Ft | |
| 09/28/2022 09/28/22 | For Rent | $2,100 | 0.0% | -- | |
| 09/09/2022 09/09/22 | Sold | $224,583 | +2.1% | $165 / Sq Ft | View Prior Sale |
| 08/11/2022 08/11/22 | Pending | -- | -- | -- | |
| 08/10/2022 08/10/22 | Price Changed | $220,000 | -2.9% | $162 / Sq Ft | |
| 07/23/2022 07/23/22 | For Sale | $226,500 | -- | $167 / Sq Ft |
| Year | Tax Paid | Tax Assessment Tax Assessment Total Assessment is a certain percentage of the fair market value that is determined by local assessors to be the total taxable value of land and additions on the property. | Land | Improvement |
|---|---|---|---|---|
| 2024 | $4,356 | $183,800 | $25,300 | $158,500 |
| 2023 | $3,902 | $164,600 | $25,300 | $139,300 |
| 2022 | $3,319 | $140,000 | $25,300 | $114,700 |
| 2021 | $1,452 | $130,400 | $25,300 | $105,100 |
| 2020 | $1,212 | $117,100 | $25,300 | $91,800 |
| 2019 | $1,177 | $116,100 | $25,300 | $90,800 |
| 2018 | $1,088 | $109,700 | $18,900 | $90,800 |
| 2017 | $1,019 | $105,500 | $18,900 | $86,600 |
| 2016 | $916 | $102,600 | $18,900 | $83,700 |
| 2014 | $738 | $94,600 | $18,900 | $75,700 |
| 2013 | $564 | $83,500 | $19,000 | $64,500 |
Landlord's Agent in 2023
Nicole Sturm
@properties
(765) 335-5588
1 in this area
2 Total Sales
G
Seller's Agent in 2022
Gilbert Sorola
Sorola Property Mgmt. Inc.
(765) 543-6678
2 in this area
10 Total Sales
Buyer's Agent in 2022
Cathy Russell
@properties
(765) 426-7000
241 in this area
673 Total Sales
Source: Indiana Regional MLS
MLS Number: 202240363
APN: 79-07-08-154-005.000-026
Disclaimer: Certain information contained herein is derived from information provided by parties other than Homes.com. All information provided is deemed reliable, but is not guaranteed to be accurate and should be independently verified.
![]() IDX information is provided exclusively for personal, non-commercial use, and may not be used for any purpose other than to identify prospective properties consumers may be interested in purchasing. Information is deemed reliable but not guaranteed.
IDX information is provided exclusively for personal, non-commercial use, and may not be used for any purpose other than to identify prospective properties consumers may be interested in purchasing. Information is deemed reliable but not guaranteed.