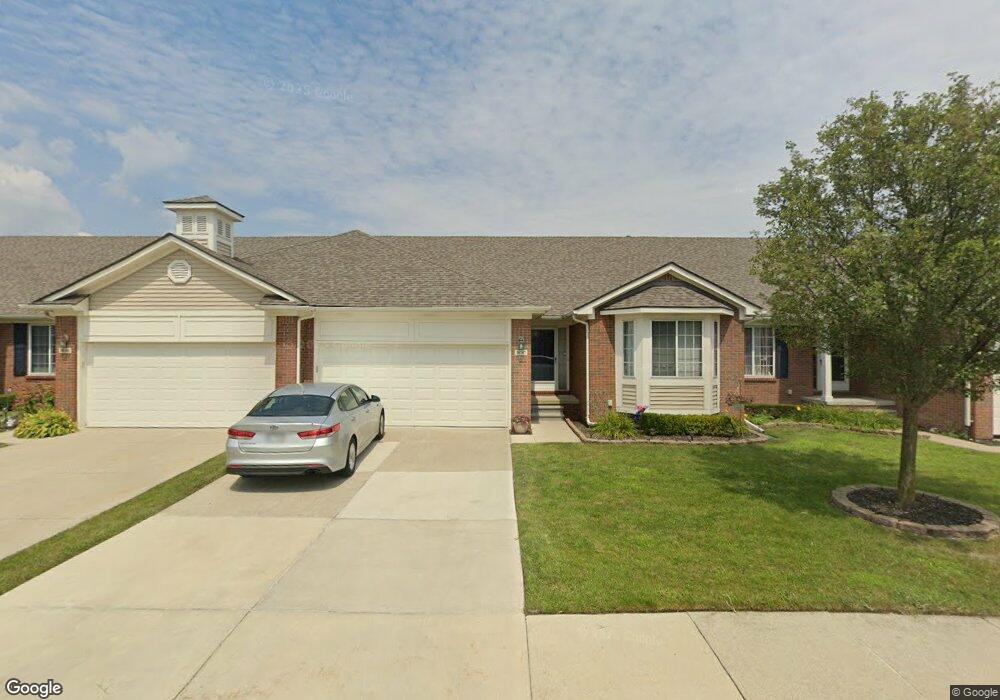
26167 Captains Landing Unit 174 Chesterfield, MI 48051
Estimated Value: $282,000 - $320,000
2
Beds
3
Baths
1,415
Sq Ft
$212/Sq Ft
Est. Value
About This Home
This home is located at 26167 Captains Landing Unit 174, Chesterfield, MI 48051 and is currently estimated at $300,623, approximately $212 per square foot. 26167 Captains Landing Unit 174 is a home located in Macomb County with nearby schools including Green Elementary School, L'Anse Creuse Middle School - North, and L'Anse Creuse High School - North.
Ownership History
Date
Name
Owned For
Owner Type
Purchase Details
Closed on
Jul 17, 2024
Sold by
Winkel Russell and Winkel Gayle
Bought by
Fremont Sarah and Fremont Richard
Current Estimated Value
Home Financials for this Owner
Home Financials are based on the most recent Mortgage that was taken out on this home.
Original Mortgage
$257,400
Outstanding Balance
$254,302
Interest Rate
6.95%
Mortgage Type
New Conventional
Estimated Equity
$46,321
Purchase Details
Closed on
Apr 25, 2007
Sold by
Admiral Development Llc
Bought by
Winkel Russell and Winkel Gayle
Create a Home Valuation Report for This Property
The Home Valuation Report is an in-depth analysis detailing your home's value as well as a comparison with similar homes in the area
Home Values in the Area
Average Home Value in this Area
Purchase History
| Date | Buyer | Sale Price | Title Company |
|---|---|---|---|
| Fremont Sarah | $290,000 | None Listed On Document | |
| Winkel Russell | $174,900 | Philip R Seaver Title Co Inc |
Source: Public Records
Mortgage History
| Date | Status | Borrower | Loan Amount |
|---|---|---|---|
| Open | Fremont Sarah | $257,400 |
Source: Public Records
Tax History Compared to Growth
Tax History
| Year | Tax Paid | Tax Assessment Tax Assessment Total Assessment is a certain percentage of the fair market value that is determined by local assessors to be the total taxable value of land and additions on the property. | Land | Improvement |
|---|---|---|---|---|
| 2025 | $3,046 | $140,200 | $0 | $0 |
| 2024 | $2,086 | $130,400 | $0 | $0 |
| 2023 | $1,978 | $119,400 | $0 | $0 |
| 2022 | $2,992 | $114,000 | $0 | $0 |
| 2021 | $2,734 | $110,200 | $0 | $0 |
| 2020 | $1,811 | $104,900 | $0 | $0 |
| 2019 | $2,362 | $96,600 | $0 | $0 |
| 2018 | $2,400 | $91,400 | $10,000 | $81,400 |
| 2017 | $2,366 | $81,400 | $10,000 | $71,400 |
| 2016 | $2,362 | $81,400 | $0 | $0 |
| 2015 | $797 | $77,400 | $0 | $0 |
| 2014 | $797 | $72,000 | $7,000 | $65,000 |
| 2012 | -- | $0 | $0 | $0 |
Source: Public Records
Map
Nearby Homes
- 47215 Admirals Cove Ln Unit 17
- 26196 Captains Landing Unit 164
- 26123 Joanne Smith Ln
- 26331 Wacker Dr
- 47302 Joanne Smith Ln
- 26207 Fairwood Dr
- 26112 Birchcrest Dr
- 53283 Woodland Dr
- 53179 Woodland Dr
- 26323 Rosebriar Dr
- 26607 Birchcrest Dr
- 48270 Applegrove Ln
- 46686 Heather Ln Unit 123
- 47608 Ramblewood Dr
- 26224 Jackgrove Ln
- 48341 Applegrove Ln Unit 11
- 48358 Applegrove Ln Unit 31, Building 8
- 48365 Applegrove Ln Unit 14
- 48382 Applegrove Ln Unit 8
- 25591 Lord Dr
- 26179 Captains Landing
- 26173 Captains Landing Unit 175
- 26155 Captains Landing Unit 72
- 26161 Captains Landing
- 26161 Captains Landing Unit 42-173
- 26179 Captains Landing Unit 42-176
- 26240 Wacker Dr Unit 203
- 26258 Wacker Dr Unit 200
- 26246 Wacker Dr Unit 48-202
- 26246 Wacker Dr
- 26160 Captains Landing
- 26172 Captains Landing
- 26166 Captains Landing
- 26154 Captains Landing Unit 171
- 26178 Captains Landing Unit 167
- 26166 Captains Landing Unit 41-169
- 26160 Captains Landing Unit 41-170
- 26172 Captains Landing Unit 41-168
- 26160 Captains Landing Unit 170
- 26185 Captains Landing