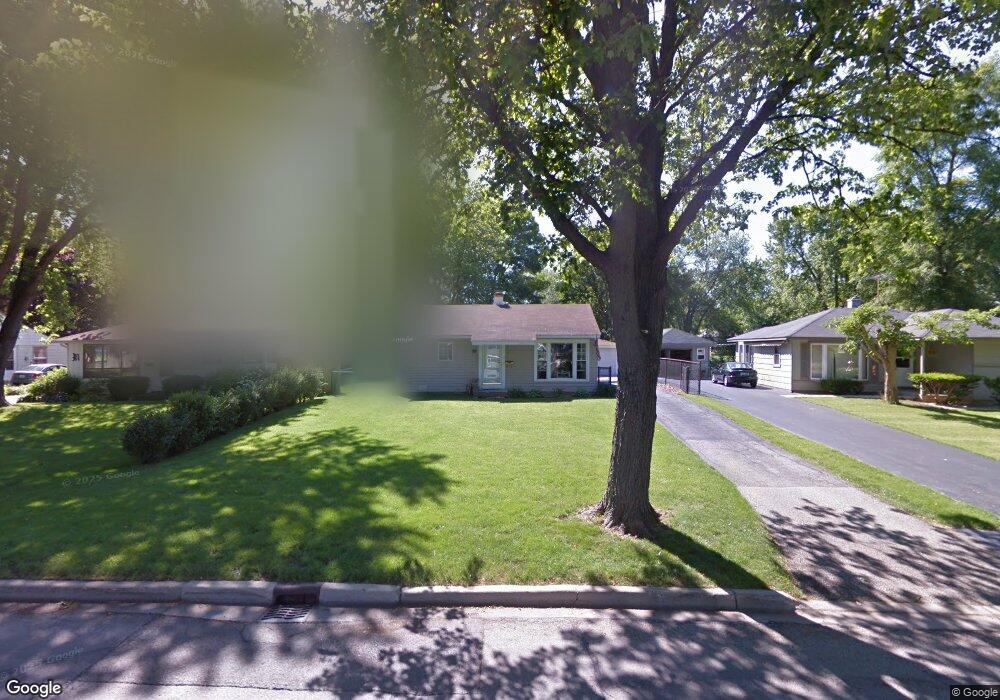
2617 Flicker Ln Rolling Meadows, IL 60008
Estimated Value: $299,000 - $358,000
3
Beds
1
Bath
1,167
Sq Ft
$284/Sq Ft
Est. Value
About This Home
This home is located at 2617 Flicker Ln, Rolling Meadows, IL 60008 and is currently estimated at $331,792, approximately $284 per square foot. 2617 Flicker Ln is a home located in Cook County with nearby schools including Kimball Hill Elementary School, Carl Sandburg Junior High School, and Rolling Meadows High School.
Ownership History
Date
Name
Owned For
Owner Type
Purchase Details
Closed on
Aug 8, 2008
Sold by
Barclay Bruce and Barclay Elizabeth
Bought by
Flanagan Deborah
Current Estimated Value
Home Financials for this Owner
Home Financials are based on the most recent Mortgage that was taken out on this home.
Original Mortgage
$199,750
Outstanding Balance
$130,606
Interest Rate
6.51%
Mortgage Type
Unknown
Estimated Equity
$201,186
Purchase Details
Closed on
Aug 17, 1998
Sold by
Moore Rory J and Moore Barbara A
Bought by
Barclay Bruce and Barclay Elizabeth
Home Financials for this Owner
Home Financials are based on the most recent Mortgage that was taken out on this home.
Original Mortgage
$147,350
Interest Rate
7.04%
Mortgage Type
VA
Purchase Details
Closed on
Nov 11, 1993
Sold by
Moore Rory J and Moore Barbra A
Bought by
Moore Rory J and Moore Barbra A
Home Financials for this Owner
Home Financials are based on the most recent Mortgage that was taken out on this home.
Original Mortgage
$100,000
Interest Rate
6.82%
Create a Home Valuation Report for This Property
The Home Valuation Report is an in-depth analysis detailing your home's value as well as a comparison with similar homes in the area
Home Values in the Area
Average Home Value in this Area
Purchase History
| Date | Buyer | Sale Price | Title Company |
|---|---|---|---|
| Flanagan Deborah | $235,000 | Golden Title | |
| Barclay Bruce | $144,500 | -- | |
| Moore Rory J | -- | -- |
Source: Public Records
Mortgage History
| Date | Status | Borrower | Loan Amount |
|---|---|---|---|
| Open | Flanagan Deborah | $199,750 | |
| Previous Owner | Barclay Bruce | $147,350 | |
| Previous Owner | Moore Rory J | $100,000 |
Source: Public Records
Tax History
| Year | Tax Paid | Tax Assessment Tax Assessment Total Assessment is a certain percentage of the fair market value that is determined by local assessors to be the total taxable value of land and additions on the property. | Land | Improvement |
|---|---|---|---|---|
| 2025 | $6,953 | $28,000 | $6,513 | $21,487 |
| 2024 | $6,953 | $26,000 | $5,511 | $20,489 |
| 2023 | $6,627 | $26,000 | $5,511 | $20,489 |
| 2022 | $6,627 | $26,000 | $5,511 | $20,489 |
| 2021 | $5,449 | $19,783 | $3,256 | $16,527 |
| 2020 | $5,394 | $19,783 | $3,256 | $16,527 |
| 2019 | $5,433 | $22,104 | $3,256 | $18,848 |
| 2018 | $5,554 | $20,584 | $3,006 | $17,578 |
| 2017 | $5,460 | $20,584 | $3,006 | $17,578 |
| 2016 | $5,346 | $20,584 | $3,006 | $17,578 |
| 2015 | $4,721 | $17,616 | $2,755 | $14,861 |
| 2014 | $4,625 | $17,616 | $2,755 | $14,861 |
| 2013 | $4,495 | $17,616 | $2,755 | $14,861 |
Source: Public Records
Map
Nearby Homes
- 2401 Rohlwing Rd
- 2600 Brookwood Way Dr Unit 316
- 2600 Brookwood Way Dr Unit 305
- 2650 Brookwood Way Dr Unit 313
- 2650 Brookwood Way Dr Unit 108
- 3265 Kirchoff Rd Unit 116
- 3345 Kirchoff Rd Unit 5C
- 304 E Tall Trees Ln
- 3 Holyoke on Auburn
- 3135 Town Square Dr Unit 401
- 3100 Town Square Dr Unit 308
- 3100 Town Square Dr Unit 204
- 2705 Park St
- 3407 Pheasant Dr
- 3000 California Ave
- 3306 Trillium Cir Unit 3001
- 3209 Trillium Cir
- 399 Knollwood Ct
- 3200 Thrush Ln
- 2 Croydon on Duxbury
- 2615 Flicker Ln
- 2703 Flicker Ln
- 2611 Flicker Ln
- 2616 Rohlwing Rd
- 2618 Rohlwing Rd
- 2614 Rohlwing Rd
- 2705 Flicker Ln
- 2609 Flicker Ln
- 2700 Rohlwing Rd
- 2612 Rohlwing Rd
- 2616 Flicker Ln
- 2614 Flicker Ln
- 2702 Rohlwing Rd
- 2707 Flicker Ln
- 2612 Flicker Ln
- 3611 Sigwalt St
- 2610 Rohlwing Rd
- 2607 Flicker Ln
- 2610 Flicker Ln
- 2704 Rohlwing Rd
Your Personal Tour Guide
Ask me questions while you tour the home.