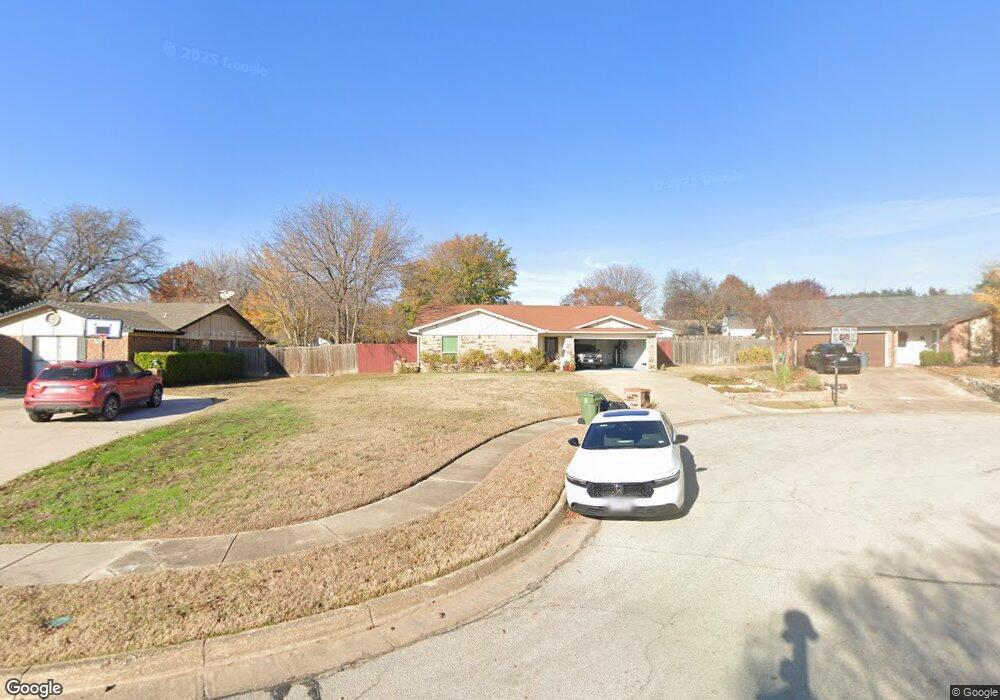
2617 Greenwood Ct Bedford, TX 76021
Estimated Value: $342,098 - $399,000
3
Beds
2
Baths
1,533
Sq Ft
$237/Sq Ft
Est. Value
About This Home
This home is located at 2617 Greenwood Ct, Bedford, TX 76021 and is currently estimated at $363,525, approximately $237 per square foot. 2617 Greenwood Ct is a home located in Tarrant County with nearby schools including Meadow Creek Elementary School, Harwood Junior High School, and Trinity High School.
Ownership History
Date
Name
Owned For
Owner Type
Purchase Details
Closed on
Jun 14, 2005
Sold by
Cabes Richard B and Cabes Corrie M
Bought by
Taylor Ray E and Taylor Carmen
Current Estimated Value
Home Financials for this Owner
Home Financials are based on the most recent Mortgage that was taken out on this home.
Original Mortgage
$108,000
Outstanding Balance
$56,382
Interest Rate
5.76%
Mortgage Type
Fannie Mae Freddie Mac
Estimated Equity
$307,143
Purchase Details
Closed on
Oct 24, 2001
Sold by
Sloan Johanna
Bought by
Cabes Richard B
Home Financials for this Owner
Home Financials are based on the most recent Mortgage that was taken out on this home.
Original Mortgage
$122,531
Interest Rate
6.84%
Mortgage Type
FHA
Purchase Details
Closed on
Jun 30, 1999
Sold by
Sloan Mark
Bought by
Sloan Johanna
Purchase Details
Closed on
Feb 2, 1994
Sold by
Poslick Martin A and Poslick Evelyn M
Bought by
Sloan Mark Rodney and Sloan Johanna Goheen
Create a Home Valuation Report for This Property
The Home Valuation Report is an in-depth analysis detailing your home's value as well as a comparison with similar homes in the area
Home Values in the Area
Average Home Value in this Area
Purchase History
| Date | Buyer | Sale Price | Title Company |
|---|---|---|---|
| Taylor Ray E | -- | Alamo Title Company | |
| Cabes Richard B | -- | Stewart Title | |
| Sloan Johanna | -- | Hexter Fair Title Co | |
| Sloan Mark Rodney | -- | -- |
Source: Public Records
Mortgage History
| Date | Status | Borrower | Loan Amount |
|---|---|---|---|
| Open | Taylor Ray E | $108,000 | |
| Previous Owner | Cabes Richard B | $122,531 |
Source: Public Records
Tax History Compared to Growth
Tax History
| Year | Tax Paid | Tax Assessment Tax Assessment Total Assessment is a certain percentage of the fair market value that is determined by local assessors to be the total taxable value of land and additions on the property. | Land | Improvement |
|---|---|---|---|---|
| 2025 | $3,492 | $298,754 | $70,000 | $228,754 |
| 2024 | $3,492 | $298,754 | $70,000 | $228,754 |
| 2023 | $5,304 | $313,322 | $45,000 | $268,322 |
| 2022 | $5,490 | $251,379 | $45,000 | $206,379 |
| 2021 | $5,741 | $245,362 | $45,000 | $200,362 |
| 2020 | $5,268 | $221,569 | $45,000 | $176,569 |
| 2019 | $5,501 | $229,637 | $45,000 | $184,637 |
| 2018 | $4,619 | $205,861 | $45,000 | $160,861 |
| 2017 | $4,527 | $197,431 | $30,000 | $167,431 |
| 2016 | $4,116 | $170,133 | $30,000 | $140,133 |
| 2015 | $3,592 | $157,675 | $30,000 | $127,675 |
| 2014 | $3,592 | $154,000 | $18,000 | $136,000 |
Source: Public Records
Map
Nearby Homes
- 2709 Willow Bend
- 3024 Highgate Ln
- 2616 Greenwood Ct
- 2600 Willow Bend
- 2922 Beachtree Ln
- 2521 Sanders Ct
- 2609 Woodson Dr
- 2700 Mimosa Ct
- 2516 Classic Ct W
- 3152 Woodbridge Dr
- 2909 Oakridge Dr
- 3001 Glenwood Ct
- 2601 Murphy Dr
- 3017 Bluebonnet Ln
- 2220 Tiffany Glenn Ct
- 3205 Princess St
- 3405 Scenic Hills Dr
- 2501 Murphy Dr
- 3024 Pecan Cir
- 3100 Emerald St
- 2613 Greenwood Ct
- 2621 Greenwood Ct
- 3009 Highgate Ln
- 3005 Highgate Ln
- 2609 Greenwood Ct
- 3017 Highgate Ln
- 2624 Greenwood Ct
- 3001 Highgate Ln
- 2925 Highgate Ln
- 2612 Greenwood Ct
- 2605 Greenwood Ct
- 2620 Greenwood Ct
- 3021 Highgate Ln
- 2921 Highgate Ln
- 2608 Greenwood Ct
- 3020 Highgate Ln
- 3016 Highgate Ln
- 2917 Highgate Ln
- 3028 Highgate Ln
- 3012 Highgate Ln