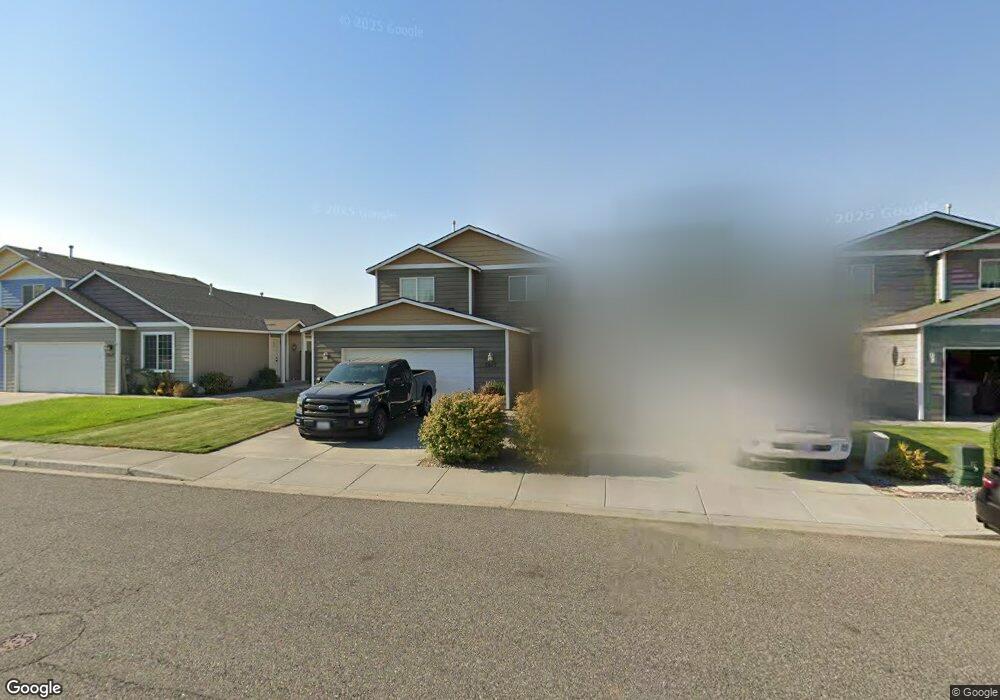
2617 Jason Loop Richland, WA 99352
Estimated Value: $382,493 - $432,000
4
Beds
3
Baths
1,911
Sq Ft
$208/Sq Ft
Est. Value
About This Home
This home is located at 2617 Jason Loop, Richland, WA 99352 and is currently estimated at $397,373, approximately $207 per square foot. 2617 Jason Loop is a home located in Benton County with nearby schools including White Bluffs Elementary School, Enterprise Middle School, and Richland High School.
Ownership History
Date
Name
Owned For
Owner Type
Purchase Details
Closed on
Sep 25, 2017
Sold by
Winder Daniel L and Winder Barbara M
Bought by
Winder Krisdan D
Current Estimated Value
Home Financials for this Owner
Home Financials are based on the most recent Mortgage that was taken out on this home.
Original Mortgage
$180,000
Outstanding Balance
$150,672
Interest Rate
3.9%
Mortgage Type
New Conventional
Estimated Equity
$246,701
Purchase Details
Closed on
Jan 11, 2011
Sold by
Sound Built Townhomes Llc
Bought by
Winder Daniel L and Winder Barbara M
Home Financials for this Owner
Home Financials are based on the most recent Mortgage that was taken out on this home.
Original Mortgage
$115,920
Interest Rate
4.43%
Mortgage Type
New Conventional
Create a Home Valuation Report for This Property
The Home Valuation Report is an in-depth analysis detailing your home's value as well as a comparison with similar homes in the area
Home Values in the Area
Average Home Value in this Area
Purchase History
| Date | Buyer | Sale Price | Title Company |
|---|---|---|---|
| Winder Krisdan D | $261,764 | Benton Franklin Title Co | |
| Winder Daniel L | $144,900 | Cascade Title |
Source: Public Records
Mortgage History
| Date | Status | Borrower | Loan Amount |
|---|---|---|---|
| Open | Winder Krisdan D | $180,000 | |
| Previous Owner | Winder Daniel L | $115,920 |
Source: Public Records
Tax History Compared to Growth
Tax History
| Year | Tax Paid | Tax Assessment Tax Assessment Total Assessment is a certain percentage of the fair market value that is determined by local assessors to be the total taxable value of land and additions on the property. | Land | Improvement |
|---|---|---|---|---|
| 2024 | $3,433 | $366,860 | $40,000 | $326,860 |
| 2023 | $3,433 | $366,860 | $40,000 | $326,860 |
| 2022 | $2,960 | $294,230 | $40,000 | $254,230 |
| 2021 | $2,772 | $266,990 | $40,000 | $226,990 |
| 2020 | $2,709 | $239,750 | $40,000 | $199,750 |
| 2019 | $1,792 | $221,590 | $40,000 | $181,590 |
| 2018 | $1,840 | $156,930 | $24,500 | $132,430 |
| 2017 | $1,619 | $134,860 | $24,500 | $110,360 |
| 2016 | $1,597 | $134,860 | $24,500 | $110,360 |
| 2015 | $1,627 | $134,860 | $24,500 | $110,360 |
| 2014 | -- | $134,860 | $24,500 | $110,360 |
| 2013 | -- | $134,860 | $24,500 | $110,360 |
Source: Public Records
Map
Nearby Homes
- 2581 Jason Loop
- 3381 Nottingham Dr
- 3680 Keene Rd - Lots 1 2 & 3 Unit 1,2&3
- 1222 Country Ridge Dr
- 1000 Nka Queensgate
- 4228 Cowlitz Blvd
- 4272 Cowlitz Blvd Unit View
- 4443 Cowlitz Blvd
- 875 Tulip Ln
- 0 Windmill Rd
- 1176 Lapins Ct
- 691 Windmill Rd
- 3529 Hanstead St
- 132 Windhaven Ln
- 681 Lonetree Ln
- 2618 Quarterhorse Way
- 677 Lonetree Ln
- 667 Lonetree Ln
- 711 Rio Vista Loop Unit Lot 2
- 2380 Lariat Ln
- 2621 Jason Loop
- 2613 Jason Loop
- 2625 Jason Loop
- 2609 Jason Loop
- 2629 Jason Loop
- 2605 Jason Loop
- 2633 Jason Loop
- 2601 Jason Loop
- 2573 Jason Loop
- 2570 Jason Loop
- 2637 Jason Loop
- 2638 Jason Loop
- 2577 Jason Loop
- 2641 Jason Loop
- 2642 Jason Loop
- 2565 Jason Loop Unit Great Buy!
- 2565 Jason Loop
- 2646 Jason Loop
- 2645 Jason Loop
- 2585 Jason Loop