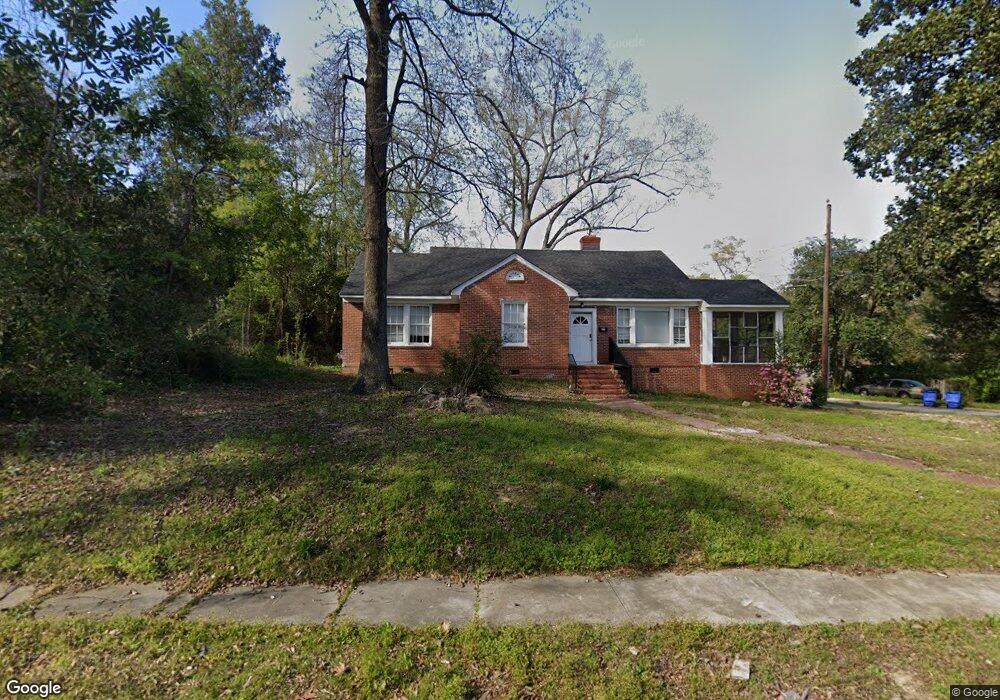
2617 Marion St Columbus, GA 31906
Briarwood NeighborhoodEstimated Value: $83,000 - $151,000
3
Beds
2
Baths
1,443
Sq Ft
$78/Sq Ft
Est. Value
About This Home
This home is located at 2617 Marion St, Columbus, GA 31906 and is currently estimated at $112,165, approximately $77 per square foot. 2617 Marion St is a home located in Muscogee County with nearby schools including Rigdon Road Elementary School, Rothschild Leadership Academy, and Carver High School.
Ownership History
Date
Name
Owned For
Owner Type
Purchase Details
Closed on
Jul 15, 2020
Sold by
Woodpark Llc
Bought by
Foster Bernard
Current Estimated Value
Home Financials for this Owner
Home Financials are based on the most recent Mortgage that was taken out on this home.
Original Mortgage
$47,500
Outstanding Balance
$15,579
Interest Rate
3.1%
Mortgage Type
New Conventional
Estimated Equity
$96,586
Purchase Details
Closed on
Apr 3, 2018
Sold by
Jackson Vernon Will
Bought by
Woodpark Llc
Create a Home Valuation Report for This Property
The Home Valuation Report is an in-depth analysis detailing your home's value as well as a comparison with similar homes in the area
Home Values in the Area
Average Home Value in this Area
Purchase History
| Date | Buyer | Sale Price | Title Company |
|---|---|---|---|
| Foster Bernard | $47,500 | -- | |
| Woodpark Llc | $14,701 | -- |
Source: Public Records
Mortgage History
| Date | Status | Borrower | Loan Amount |
|---|---|---|---|
| Open | Foster Bernard | $47,500 |
Source: Public Records
Tax History Compared to Growth
Tax History
| Year | Tax Paid | Tax Assessment Tax Assessment Total Assessment is a certain percentage of the fair market value that is determined by local assessors to be the total taxable value of land and additions on the property. | Land | Improvement |
|---|---|---|---|---|
| 2025 | $2,274 | $58,088 | $5,512 | $52,576 |
| 2024 | $861 | $46,792 | $5,512 | $41,280 |
| 2023 | $867 | $22,000 | $3,360 | $18,640 |
| 2022 | $1,209 | $29,612 | $5,512 | $24,100 |
| 2021 | $869 | $19,000 | $3,480 | $15,520 |
| 2020 | $1,223 | $29,956 | $5,512 | $24,444 |
| 2019 | $241 | $5,880 | $1,480 | $4,400 |
| 2018 | $1,194 | $29,132 | $5,512 | $23,620 |
| 2017 | $7 | $29,132 | $5,512 | $23,620 |
| 2016 | $7 | $13,920 | $3,379 | $10,541 |
| 2015 | $3 | $13,920 | $3,379 | $10,541 |
| 2014 | $3 | $13,920 | $3,379 | $10,541 |
| 2013 | -- | $13,920 | $3,379 | $10,541 |
Source: Public Records
Map
Nearby Homes
- 1164 Tate Dr
- 2726 Marion St
- 1310 S Dixon Dr
- 1054 Lawyers Ln
- 1319 Hilton Ave
- 2533 15th St
- 2429 Bell St
- 1513 Wells Dr
- 2312 Marion St
- 2400 Bell St
- 2717 10th St
- 1301 Rigdon Rd
- 1227 Forest Ave Unit 4
- 2911 Gardenia St
- 2916 Gardenia St
- 2902 Hood St
- 1500 Preston Dr
- 2229 10th St
- 2227 15th St
- 1531 Wildwood Ave
- 1215 Azalea Ct
- 1208 Azalea Ct
- 2618 Marion St
- 1212 Azalea Ct
- 2609 Marion St
- 2616 Marion St
- 2620 Marion St
- 1158 Tate Dr
- 2614 Marion St
- 1221 Azalea Ct
- 2628 Marion St
- 1233 S Dixon Dr
- 2610 Marion St
- 2627 Schaul St
- 1243 S Dixon Dr
- 1227 Azalea Ct
- 2708 Marion St
- 2606 Marion St
- 2607 Schaul St
- 1247 S Dixon Dr