Estimated Value: $353,000 - $445,000
Studio
--
Bath
1,307
Sq Ft
$316/Sq Ft
Est. Value
About This Home
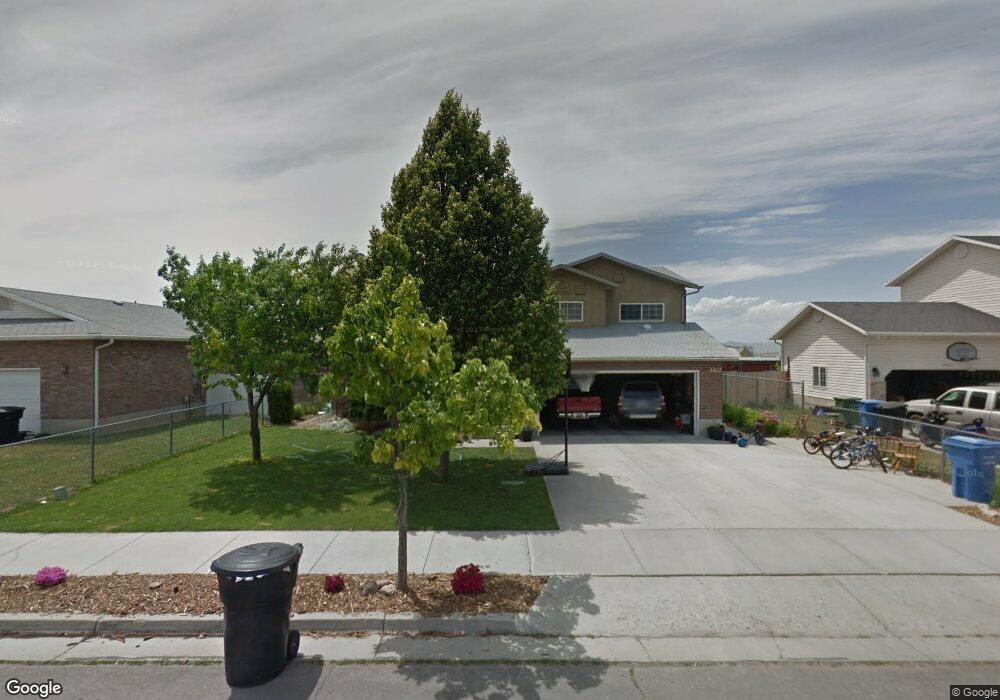
This home is located at 2617 N 200 E, Logan, UT 84341 and is currently estimated at $413,296, approximately $316 per square foot. 2617 N 200 E is a home with nearby schools including Greenville School, Cedar Ridge School, and North Cache Middle School.
Ownership History
Date
Name
Owned For
Owner Type
Purchase Details
Closed on
Jan 2, 2025
Sold by
Fj & Z Llc
Bought by
Fj & Z Trust and Zmerzlikar
Current Estimated Value
Purchase Details
Closed on
Dec 16, 2024
Sold by
Fj & Z Llc
Bought by
Fj & Z Trust and Zmerzlikar
Purchase Details
Closed on
Sep 19, 2014
Sold by
Downs Jerry and Downs Rene
Bought by
Fj & Z Llc
Home Financials for this Owner
Home Financials are based on the most recent Mortgage that was taken out on this home.
Original Mortgage
$100,000
Interest Rate
4.1%
Mortgage Type
Seller Take Back
Purchase Details
Closed on
Jul 5, 2014
Sold by
Burr Jason and Burr Cassandra
Bought by
Downs Jerry and Downs Rene
Purchase Details
Closed on
Jul 31, 2008
Sold by
Downs Jerry and Downs Rene
Bought by
Burr Jason and Burr Cassandra
Home Financials for this Owner
Home Financials are based on the most recent Mortgage that was taken out on this home.
Original Mortgage
$170,181
Interest Rate
10%
Mortgage Type
Seller Take Back
Create a Home Valuation Report for This Property
The Home Valuation Report is an in-depth analysis detailing your home's value as well as a comparison with similar homes in the area
Home Values in the Area
Average Home Value in this Area
Purchase History
| Date | Buyer | Sale Price | Title Company |
|---|---|---|---|
| Fj & Z Trust | -- | None Listed On Document | |
| Fj & Z Trust | -- | None Listed On Document | |
| Fj & Z Trust | -- | None Listed On Document | |
| Fj & Z Llc | -- | Hickman Land Title Company | |
| Downs Jerry | -- | Hickman Land Title Company | |
| Burr Jason | -- | Hickman Land Title Company |
Source: Public Records
Mortgage History
| Date | Status | Borrower | Loan Amount |
|---|---|---|---|
| Previous Owner | Fj & Z Llc | $100,000 | |
| Previous Owner | Burr Jason | $170,181 |
Source: Public Records
Tax History
| Year | Tax Paid | Tax Assessment Tax Assessment Total Assessment is a certain percentage of the fair market value that is determined by local assessors to be the total taxable value of land and additions on the property. | Land | Improvement |
|---|---|---|---|---|
| 2025 | $3,137 | $439,070 | $0 | $0 |
| 2024 | $3,031 | $394,770 | $0 | $0 |
| 2023 | $3,271 | $393,885 | $0 | $0 |
| 2022 | $3,423 | $393,885 | $0 | $0 |
| 2021 | $33 | $326,110 | $55,000 | $271,110 |
| 2020 | $2,489 | $228,684 | $55,000 | $173,684 |
| 2019 | $1,433 | $228,684 | $55,000 | $173,684 |
| 2018 | $1,229 | $189,790 | $38,760 | $151,030 |
| 2017 | $1,191 | $96,835 | $0 | $0 |
| 2016 | $1,210 | $96,835 | $0 | $0 |
| 2015 | $1,172 | $93,375 | $0 | $0 |
| 2014 | $1,145 | $93,375 | $0 | $0 |
| 2013 | -- | $92,250 | $0 | $0 |
Source: Public Records
Map
Nearby Homes
- 2592 N 330 E
- 2664 N 330 E
- 2452 N 200 E
- 2070 U S 91
- 2386 N 150 E
- 2807 N Main St
- 2640 N Aspen Park Ln
- 623 E 2475 N Unit 5
- 645 E 2475 N
- 667 E 2475 N
- 385 E 2280 N Unit D
- 327 E 2230 N Unit A
- 400 W 3100 N
- 2469 N 620 E Unit 3
- 2477 N 620 E Unit 4
- 680 S 50 E Unit 112
- 276 W 450 S
- 2048 N 350 E
- 210 S 100 W
- 395 W 3200 N
Your Personal Tour Guide
Ask me questions while you tour the home.