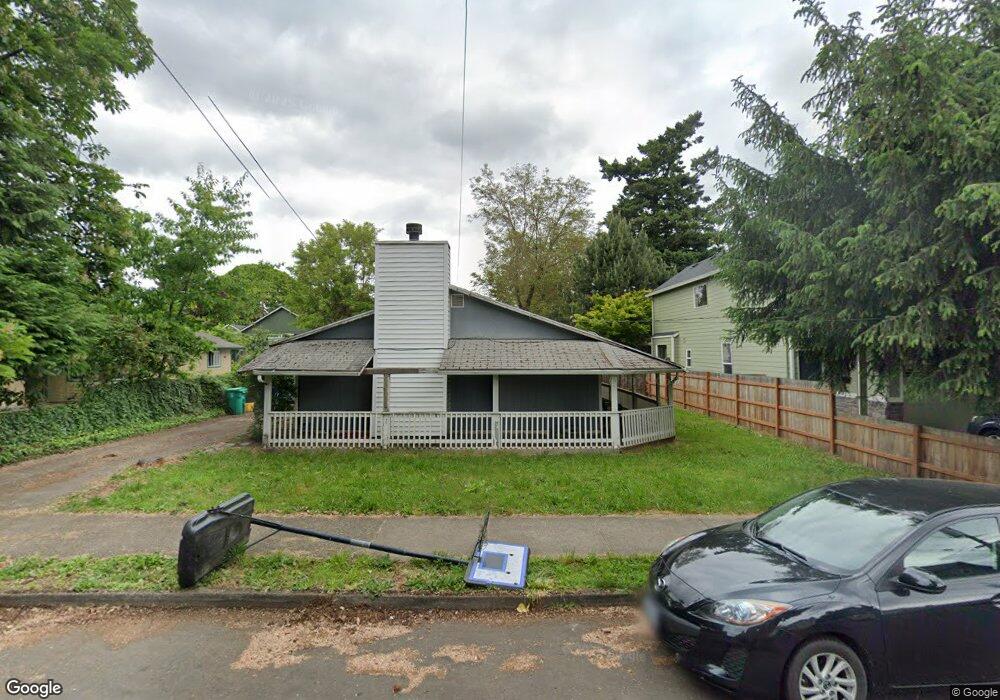
2617 N Argyle St Portland, OR 97217
Kenton NeighborhoodEstimated Value: $443,271 - $483,000
3
Beds
2
Baths
1,232
Sq Ft
$373/Sq Ft
Est. Value
About This Home
This home is located at 2617 N Argyle St, Portland, OR 97217 and is currently estimated at $459,568, approximately $373 per square foot. 2617 N Argyle St is a home located in Multnomah County with nearby schools including Peninsula Elementary School, Ockley Green, and Jefferson High School.
Ownership History
Date
Name
Owned For
Owner Type
Purchase Details
Closed on
Jul 10, 2003
Sold by
White Ward
Bought by
Downs Justin H
Current Estimated Value
Home Financials for this Owner
Home Financials are based on the most recent Mortgage that was taken out on this home.
Original Mortgage
$107,200
Outstanding Balance
$46,856
Interest Rate
5.75%
Mortgage Type
Purchase Money Mortgage
Estimated Equity
$412,712
Purchase Details
Closed on
Nov 26, 2002
Sold by
Lopez Leticia
Bought by
White Ward
Home Financials for this Owner
Home Financials are based on the most recent Mortgage that was taken out on this home.
Original Mortgage
$84,800
Interest Rate
6.12%
Mortgage Type
Purchase Money Mortgage
Purchase Details
Closed on
Jan 27, 1997
Sold by
Suchy John P
Bought by
Lopez Leticia and Robledo David
Home Financials for this Owner
Home Financials are based on the most recent Mortgage that was taken out on this home.
Original Mortgage
$70,641
Interest Rate
7.62%
Mortgage Type
Purchase Money Mortgage
Create a Home Valuation Report for This Property
The Home Valuation Report is an in-depth analysis detailing your home's value as well as a comparison with similar homes in the area
Home Values in the Area
Average Home Value in this Area
Purchase History
| Date | Buyer | Sale Price | Title Company |
|---|---|---|---|
| Downs Justin H | $134,000 | Transnation | |
| White Ward | $106,000 | Transnation Title Insurance | |
| Lopez Leticia | $79,000 | Fidelity National Title Co |
Source: Public Records
Mortgage History
| Date | Status | Borrower | Loan Amount |
|---|---|---|---|
| Open | Downs Justin H | $107,200 | |
| Previous Owner | White Ward | $84,800 | |
| Previous Owner | Lopez Leticia | $70,641 | |
| Closed | White Ward | $21,200 | |
| Closed | Downs Justin H | $26,800 |
Source: Public Records
Tax History Compared to Growth
Tax History
| Year | Tax Paid | Tax Assessment Tax Assessment Total Assessment is a certain percentage of the fair market value that is determined by local assessors to be the total taxable value of land and additions on the property. | Land | Improvement |
|---|---|---|---|---|
| 2025 | $4,028 | $149,480 | -- | -- |
| 2024 | $3,883 | $145,130 | -- | -- |
| 2023 | $3,734 | $140,910 | $0 | $0 |
| 2022 | $3,653 | $136,810 | $0 | $0 |
| 2021 | $3,591 | $132,830 | $0 | $0 |
| 2020 | $3,295 | $128,970 | $0 | $0 |
| 2019 | $3,174 | $125,220 | $0 | $0 |
| 2018 | $3,081 | $121,580 | $0 | $0 |
| 2017 | $2,953 | $118,040 | $0 | $0 |
| 2016 | $2,702 | $114,610 | $0 | $0 |
| 2015 | $2,631 | $111,280 | $0 | $0 |
| 2014 | $2,592 | $108,040 | $0 | $0 |
Source: Public Records
Map
Nearby Homes
- 8280 N Burrage Ave
- 2622 N Kilpatrick St
- 2624 N Kilpatrick St
- 2620 N Kilpatrick St
- 8767 N Peninsular Ave
- 2544 N Watts St
- 2810 N Watts St
- 2515 N Winchell St
- 7817 N Delaware Ave
- 2325 N Winchell St
- 2504 N Baldwin St
- 7827 N Denver Ave
- 1597 N Mcclellan St Unit 5
- 1920 N Farragut St
- 3835 N Willis Blvd Unit 1
- 7385 N Mobile Ave
- 7387 N Mobile Ave
- 7383 N Mobile Ave
- 7379 N Mobile Ave
- 3839 N Willis Blvd Unit 2
- 2605 N Argyle St
- 2631 N Argyle St
- 2569 N Argyle St
- 2586 N Hunt St
- 2563 N Argyle St
- 2574 N Hunt St
- 2598 N Hunt St
- 2560 N Hunt St
- 2608 N Argyle St
- 8504 N Burrage Ave
- 2553 N Argyle St
- 2630 N Argyle St
- 8518 N Burrage Ave
- 2564 N Argyle St
- 2608 N Hunt St
- 2548 N Hunt St
- 2640 N Argyle St
- 2552 N Argyle St
- 2539 N Argyle St
- 8618 N Burrage Ave