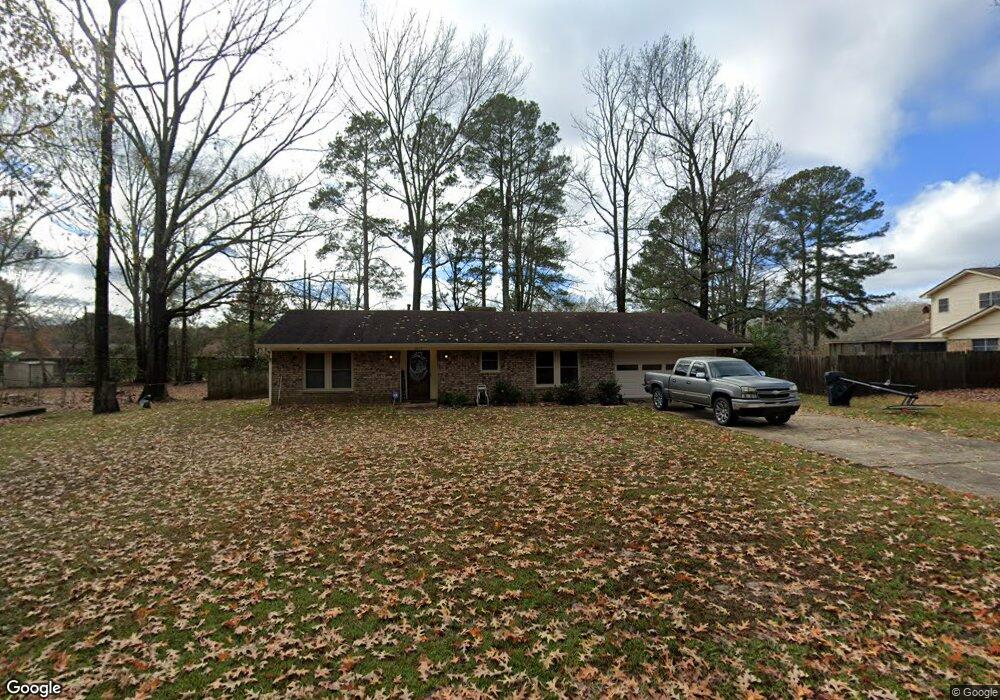
2617 Parnell Rd El Dorado, AR 71730
Estimated Value: $180,000 - $199,000
--
Bed
2
Baths
1,729
Sq Ft
$110/Sq Ft
Est. Value
About This Home
This home is located at 2617 Parnell Rd, El Dorado, AR 71730 and is currently estimated at $189,386, approximately $109 per square foot. 2617 Parnell Rd is a home located in Union County with nearby schools including El Dorado High School, West Side Christian School, and Holy Redeemer School.
Ownership History
Date
Name
Owned For
Owner Type
Purchase Details
Closed on
Sep 11, 2014
Sold by
Vickers Jeffrey E and Vickers Trisha
Bought by
Smith Kenya and Smith Kendra
Current Estimated Value
Home Financials for this Owner
Home Financials are based on the most recent Mortgage that was taken out on this home.
Original Mortgage
$124,699
Outstanding Balance
$95,852
Interest Rate
4.25%
Mortgage Type
FHA
Estimated Equity
$93,534
Purchase Details
Closed on
Jun 9, 2006
Sold by
Bush Rusty J and Bush Merranda S
Bought by
Vickers Jeffrey E and Vickers Trisha
Home Financials for this Owner
Home Financials are based on the most recent Mortgage that was taken out on this home.
Original Mortgage
$96,000
Interest Rate
6.56%
Mortgage Type
Purchase Money Mortgage
Purchase Details
Closed on
Sep 19, 2003
Bought by
Bush Rusty J
Purchase Details
Closed on
Jan 1, 1983
Bought by
Black Rodell
Create a Home Valuation Report for This Property
The Home Valuation Report is an in-depth analysis detailing your home's value as well as a comparison with similar homes in the area
Home Values in the Area
Average Home Value in this Area
Purchase History
| Date | Buyer | Sale Price | Title Company |
|---|---|---|---|
| Smith Kenya | $127,000 | -- | |
| Vickers Jeffrey E | $96,000 | None Available | |
| Bush Rusty J | $83,000 | -- | |
| Black Rodell | -- | -- |
Source: Public Records
Mortgage History
| Date | Status | Borrower | Loan Amount |
|---|---|---|---|
| Open | Smith Kenya | $124,699 | |
| Previous Owner | Vickers Jeffrey E | $96,000 |
Source: Public Records
Tax History Compared to Growth
Tax History
| Year | Tax Paid | Tax Assessment Tax Assessment Total Assessment is a certain percentage of the fair market value that is determined by local assessors to be the total taxable value of land and additions on the property. | Land | Improvement |
|---|---|---|---|---|
| 2024 | $821 | $28,570 | $3,000 | $25,570 |
| 2023 | $836 | $28,570 | $3,000 | $25,570 |
| 2022 | $709 | $23,360 | $3,000 | $20,360 |
| 2021 | $709 | $23,360 | $3,000 | $20,360 |
| 2020 | $709 | $23,360 | $3,000 | $20,360 |
| 2019 | $644 | $23,360 | $3,000 | $20,360 |
| 2018 | $644 | $23,360 | $3,000 | $20,360 |
| 2017 | $579 | $20,410 | $3,000 | $17,410 |
| 2016 | $579 | $20,410 | $3,000 | $17,410 |
| 2015 | $929 | $20,410 | $3,000 | $17,410 |
| 2014 | $579 | $20,410 | $3,000 | $17,410 |
Source: Public Records
Map
Nearby Homes
- 2602 Deer Crossing St
- 2715 Deer Crossing
- 619 Nolia Ave
- 508 Carol Ave
- Off Wrights Ln
- 3249 W Hillsboro St
- 135 Mayhaw Ln
- 300 Archer Ave
- 2305 W Main St
- 226 Cedar Hills
- 2203 W Elm St
- 2007 W Oak St
- 1706 W Block St
- 120 Meadow Hills Dr
- 2009 Ridgewood Dr
- 1913 W Oak St
- 1705 W Cedar St
- 1501 W Block St
- 1605 W Cedar St
- 1401 W Cedar St
- 2615 Parnell Rd
- 705 Lawton Dr
- 2620 Deer Crossing St
- 2624 Deer Crossing St
- 2618 Deer Crossing St
- 2613 Parnell Rd
- 709 Lawton Dr
- 2614 Deer Crossing St
- 704 Lawton Dr
- 2620 Parnell Rd
- 2611 Parnell Rd
- 2705 Parnell Rd
- 2606 Deer Crossing St
- 708 Lawton Dr
- 2623 Deer Crossing St
- 2621 Deer Crossing St
- 2625 Deer Crossing St
- 2619 Deer Crossing St
- 2609 Parnell Rd
- 629 Nolia Ave