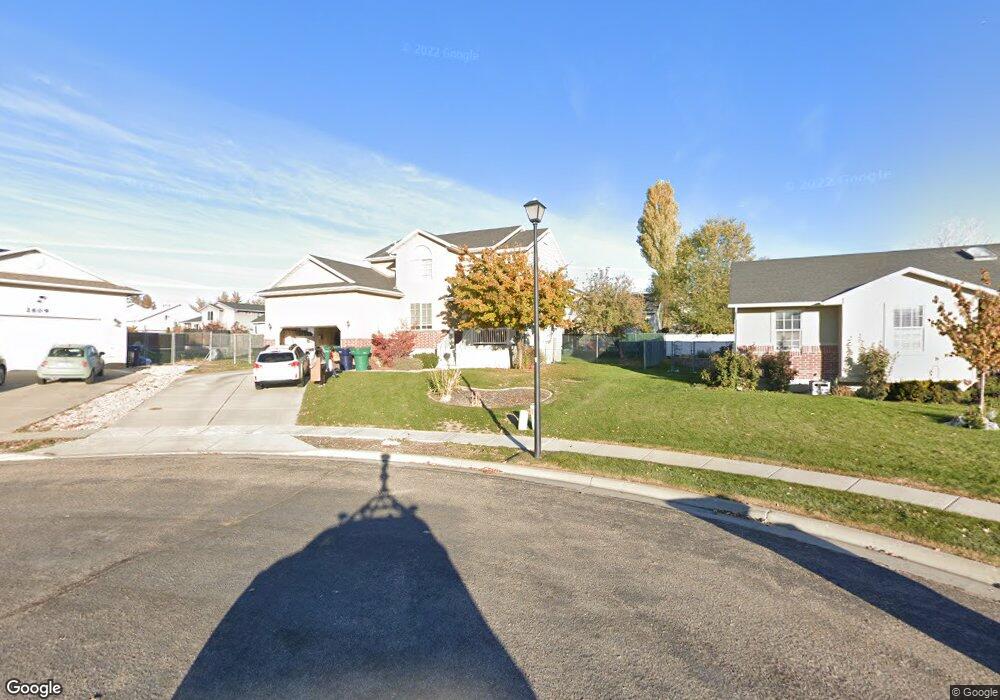
2617 S 200 E Clearfield, UT 84015
Estimated Value: $503,000 - $563,000
3
Beds
3
Baths
2,875
Sq Ft
$181/Sq Ft
Est. Value
About This Home
This home is located at 2617 S 200 E, Clearfield, UT 84015 and is currently estimated at $521,139, approximately $181 per square foot. 2617 S 200 E is a home located in Davis County with nearby schools including Legacy Junior High School, Layton High School, and North Davis Preparatory Academy.
Ownership History
Date
Name
Owned For
Owner Type
Purchase Details
Closed on
Dec 16, 2005
Sold by
Rich Ryan D and Rich Karen D
Bought by
Olkowski Steven D and Hsu Pinting
Current Estimated Value
Purchase Details
Closed on
Nov 28, 2001
Sold by
Russell Alan D
Bought by
Mark Higley Construction Lc
Home Financials for this Owner
Home Financials are based on the most recent Mortgage that was taken out on this home.
Original Mortgage
$157,177
Interest Rate
6.63%
Mortgage Type
FHA
Purchase Details
Closed on
Nov 27, 2001
Sold by
Mark Higley Construction Lc
Bought by
Rich Ryan D and Rich Karen D
Home Financials for this Owner
Home Financials are based on the most recent Mortgage that was taken out on this home.
Original Mortgage
$157,177
Interest Rate
6.63%
Mortgage Type
FHA
Create a Home Valuation Report for This Property
The Home Valuation Report is an in-depth analysis detailing your home's value as well as a comparison with similar homes in the area
Home Values in the Area
Average Home Value in this Area
Purchase History
| Date | Buyer | Sale Price | Title Company |
|---|---|---|---|
| Olkowski Steven D | -- | Security Title | |
| Mark Higley Construction Lc | -- | Heritage West Title Insuranc | |
| Rich Ryan D | -- | Heritage West Title Insuranc |
Source: Public Records
Mortgage History
| Date | Status | Borrower | Loan Amount |
|---|---|---|---|
| Previous Owner | Rich Ryan D | $157,177 |
Source: Public Records
Tax History
| Year | Tax Paid | Tax Assessment Tax Assessment Total Assessment is a certain percentage of the fair market value that is determined by local assessors to be the total taxable value of land and additions on the property. | Land | Improvement |
|---|---|---|---|---|
| 2025 | $2,958 | $265,100 | $83,475 | $181,625 |
| 2024 | $2,851 | $257,400 | $79,749 | $177,651 |
| 2023 | $2,638 | $437,000 | $126,837 | $310,163 |
| 2022 | $2,878 | $257,951 | $71,891 | $186,060 |
| 2021 | $2,556 | $346,000 | $80,453 | $265,547 |
| 2020 | $2,343 | $315,000 | $68,428 | $246,572 |
| 2019 | $2,268 | $301,000 | $68,918 | $232,082 |
| 2018 | $2,127 | $275,000 | $61,172 | $213,828 |
| 2016 | $1,855 | $125,400 | $24,703 | $100,697 |
| 2015 | $1,815 | $116,985 | $24,703 | $92,282 |
| 2014 | $1,742 | $113,812 | $24,703 | $89,109 |
| 2013 | -- | $97,732 | $29,480 | $68,252 |
Source: Public Records
Map
Nearby Homes
- 1250 N 2925 W
- 195 E 2325 S
- 2480 S Main St
- 3250 W 1075 N
- 2345 S Main St
- 816 N 2700 W
- 3389 W Gordon Ave
- 1186 N 2425 W
- 1141 N 2275 W
- 1969 S 575 E
- 841 N 2175 W
- 1877 S 725 E
- 273 N 2975 W
- 867 N 2125 W
- 369 W 1900 S
- 460 E 1700 S Unit 1 & 2
- 906 E Sam Cir
- 1876 W 1575 N Unit 237
- 1570 N 1875 W Unit 242
- 1570 N 1875 W
Your Personal Tour Guide
Ask me questions while you tour the home.