2617 S Bay St Georgetown, SC 29440
Estimated Value: $375,000 - $398,000
3
Beds
3
Baths
1,952
Sq Ft
$199/Sq Ft
Est. Value
About This Home
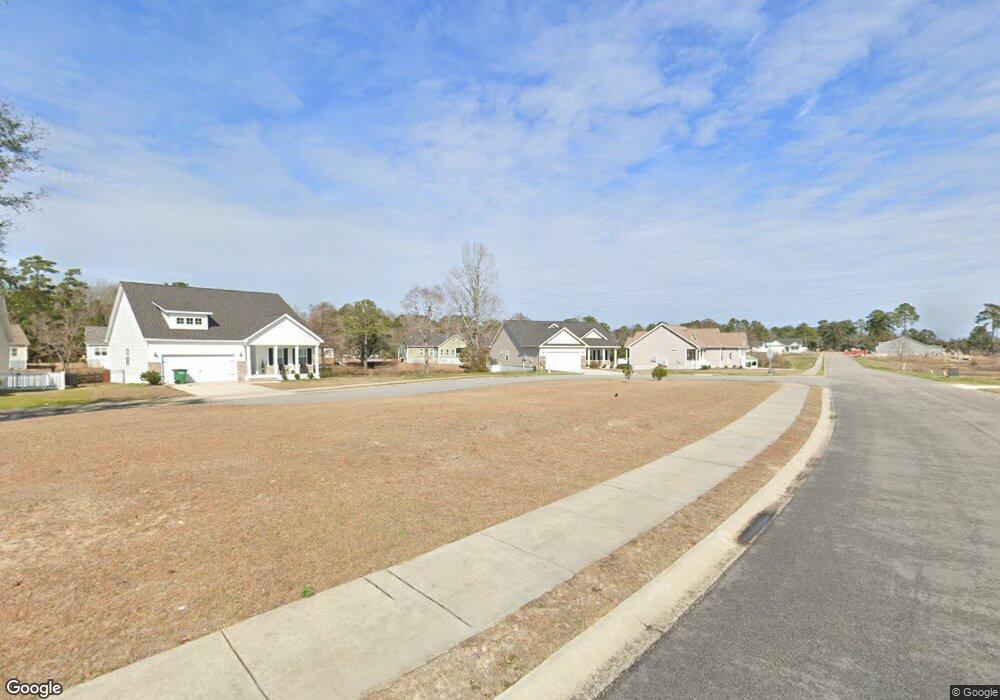
This home is located at 2617 S Bay St, Georgetown, SC 29440 and is currently estimated at $388,134, approximately $198 per square foot. 2617 S Bay St is a home located in Georgetown County with nearby schools including Maryville Elementary School, Georgetown Middle School, and Georgetown High School.
Ownership History
Date
Name
Owned For
Owner Type
Purchase Details
Closed on
Jan 30, 2026
Sold by
Swisher Mildred A
Bought by
Shumate Cole Douglas
Current Estimated Value
Home Financials for this Owner
Home Financials are based on the most recent Mortgage that was taken out on this home.
Original Mortgage
$388,408
Outstanding Balance
$388,408
Interest Rate
6.21%
Mortgage Type
VA
Estimated Equity
-$274
Purchase Details
Closed on
Dec 13, 2021
Sold by
Harbor Club Builders Llc
Bought by
Swisher Edward A and Swisher Mildred A
Home Financials for this Owner
Home Financials are based on the most recent Mortgage that was taken out on this home.
Original Mortgage
$183,535
Interest Rate
3.14%
Mortgage Type
New Conventional
Purchase Details
Closed on
Oct 27, 2021
Sold by
Harbor Club Builders Llc
Bought by
Robinett Catherine J and Wells Robbin Lea
Home Financials for this Owner
Home Financials are based on the most recent Mortgage that was taken out on this home.
Original Mortgage
$183,535
Interest Rate
3.14%
Mortgage Type
New Conventional
Purchase Details
Closed on
Jan 2, 2008
Sold by
South Bay Properties Llc
Bought by
Equity Trust Co and Patricia T Nicotera Ira
Create a Home Valuation Report for This Property
The Home Valuation Report is an in-depth analysis detailing your home's value as well as a comparison with similar homes in the area
Home Values in the Area
Average Home Value in this Area
Purchase History
| Date | Buyer | Sale Price | Title Company |
|---|---|---|---|
| Shumate Cole Douglas | $376,000 | None Listed On Document | |
| Shumate Cole Douglas | $376,000 | None Listed On Document | |
| Swisher Edward A | $283,535 | None Available | |
| Swisher Edward A | $283,535 | None Listed On Document | |
| Swisher Edward A | $283,535 | None Available | |
| Swisher Edward A | $283,535 | None Listed On Document | |
| Robinett Catherine J | $284,320 | None Listed On Document | |
| Robinett Catherine J | $284,320 | None Listed On Document | |
| Equity Trust Co | $161,250 | Attorney | |
| Equity Trust Co | $161,250 | Attorney |
Source: Public Records
Mortgage History
| Date | Status | Borrower | Loan Amount |
|---|---|---|---|
| Open | Shumate Cole Douglas | $388,408 | |
| Previous Owner | Swisher Edward A | $183,535 |
Source: Public Records
Tax History
| Year | Tax Paid | Tax Assessment Tax Assessment Total Assessment is a certain percentage of the fair market value that is determined by local assessors to be the total taxable value of land and additions on the property. | Land | Improvement |
|---|---|---|---|---|
| 2025 | $2,431 | $12,696 | $972 | $11,724 |
| 2024 | $2,431 | $11,040 | $600 | $10,440 |
| 2023 | $2,630 | $11,040 | $600 | $10,440 |
| 2022 | $2,336 | $11,040 | $600 | $10,440 |
| 2021 | $284 | $0 | $0 | $0 |
| 2020 | $284 | $0 | $0 | $0 |
| 2019 | $279 | $0 | $0 | $0 |
| 2018 | $281 | $0 | $0 | $0 |
| 2017 | $264 | $0 | $0 | $0 |
| 2016 | $261 | $900 | $0 | $0 |
| 2015 | $658 | $0 | $0 | $0 |
| 2014 | $658 | $40,000 | $40,000 | $0 |
| 2012 | -- | $40,000 | $40,000 | $0 |
Source: Public Records
Map
Nearby Homes
- 309 Chaff Ct
- 302 Chaff Ct Unit Lot 159 Corrlla 3 Ca
- TBD Seaport Cir
- Lot 404 Two Rivers Rd
- 308 Concorde Dr
- 2664 Seaport Cir
- 408 Rosemary St
- Lot 125 Seaport Cir
- 410 Grain Field Dr
- 425 Grain Field Dr
- 427 Dawson St
- TBD Grassland Ln
- 2813 Grassland Ln Unit Harbor Club on Winya
- Lot 54 Grassland Ln
- 2510 Redwood St
- 2425 S Bay St
- 2423 S Bay St
- 531 Charlton Blvd
- 809 Cedar St
- 811 Cedar St
- 2617 S Bay St
- 2617 S Bay St
- 401 Birch St
- 310 Chaff Ct Unit Lot 157 Custom Plan
- 2618 S Bay St
- 405 Birch St
- 2 S Bay St
- 400 Two Rivers Rd Unit Lot 105 Sullivan Pla
- 406 Birch St
- 311 Concord Dr Unit Lot 146 Indigo Plan
- Lot 160 S Seaport Cir
- 411 Birch St
- 2706 Seaport Cir Unit Lot 160 Dogwood Plan
- 305 Chaff Ct Unit Lot 155 Custom Plan
- 307 Concord Dr Unit Lot 147 Tucker Plan
- 2614 S Bay St
- 408 Two Rivers Rd Unit Lot 103 Live Oak Pla
- Lot 104 Two Rivers Rd
- TBD Chaff Ct Unit Lot 155 Harbor Club
- 301 Chaff Ct Unit Lot 154 Sanibel Plan
Your Personal Tour Guide
Ask me questions while you tour the home.