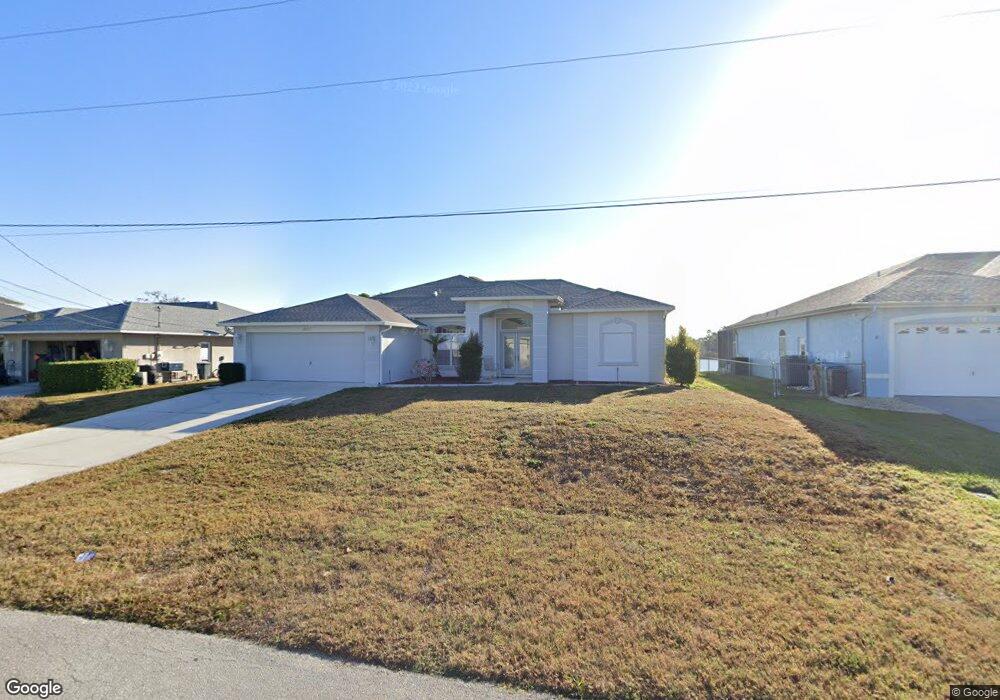
2617 SW 15th Ave Cape Coral, FL 33914
Pelican NeighborhoodEstimated Value: $454,282 - $638,000
3
Beds
3
Baths
2,138
Sq Ft
$248/Sq Ft
Est. Value
About This Home
This home is located at 2617 SW 15th Ave, Cape Coral, FL 33914 and is currently estimated at $530,571, approximately $248 per square foot. 2617 SW 15th Ave is a home located in Lee County with nearby schools including Cape Elementary School, Caloosa Elementary School, and Tropic Isles Elementary School.
Ownership History
Date
Name
Owned For
Owner Type
Purchase Details
Closed on
Jul 18, 2018
Sold by
Furr Patricia
Bought by
Furr Patricia M and Furr Katherine
Current Estimated Value
Purchase Details
Closed on
Dec 15, 2017
Sold by
Hood Darlene D
Bought by
Furr Patricia
Purchase Details
Closed on
Aug 14, 1998
Sold by
Holiday Builders Inc
Bought by
Hood Eugene J and Hood Darlene D
Home Financials for this Owner
Home Financials are based on the most recent Mortgage that was taken out on this home.
Original Mortgage
$120,200
Interest Rate
6.92%
Purchase Details
Closed on
Aug 4, 1998
Sold by
Hood Eugene J and Hood Darlene D
Bought by
Hood Darlene D and Darlene D Hood Trust
Home Financials for this Owner
Home Financials are based on the most recent Mortgage that was taken out on this home.
Original Mortgage
$120,200
Interest Rate
6.92%
Purchase Details
Closed on
Mar 31, 1998
Sold by
Hood Eugene J and Hood Darlene D
Bought by
Holiday Builders Inc
Purchase Details
Closed on
Mar 5, 1998
Sold by
Sager Milton S and Sager Lilly S
Bought by
Hood Eugene J and Hood Darlene D
Create a Home Valuation Report for This Property
The Home Valuation Report is an in-depth analysis detailing your home's value as well as a comparison with similar homes in the area
Home Values in the Area
Average Home Value in this Area
Purchase History
| Date | Buyer | Sale Price | Title Company |
|---|---|---|---|
| Furr Patricia M | -- | Attorney | |
| Furr Patricia | $365,000 | Attorney | |
| Hood Eugene J | $158,300 | -- | |
| Hood Darlene D | -- | Attorney | |
| Holiday Builders Inc | -- | -- | |
| Hood Eugene J | $21,000 | -- |
Source: Public Records
Mortgage History
| Date | Status | Borrower | Loan Amount |
|---|---|---|---|
| Previous Owner | Hood Eugene J | $120,200 |
Source: Public Records
Tax History Compared to Growth
Tax History
| Year | Tax Paid | Tax Assessment Tax Assessment Total Assessment is a certain percentage of the fair market value that is determined by local assessors to be the total taxable value of land and additions on the property. | Land | Improvement |
|---|---|---|---|---|
| 2025 | $4,252 | $260,367 | -- | -- |
| 2024 | $4,114 | $253,029 | -- | -- |
| 2023 | $4,114 | $245,659 | $0 | $0 |
| 2022 | $3,844 | $238,504 | $0 | $0 |
| 2021 | $3,938 | $365,811 | $76,040 | $289,771 |
| 2020 | $3,996 | $228,360 | $0 | $0 |
| 2019 | $3,880 | $223,226 | $0 | $0 |
| 2018 | $3,870 | $219,064 | $0 | $0 |
| 2017 | $2,738 | $156,640 | $0 | $0 |
| 2016 | $2,670 | $286,712 | $46,323 | $240,389 |
| 2015 | $2,679 | $293,506 | $32,001 | $261,505 |
| 2014 | -- | $222,187 | $30,427 | $191,760 |
| 2013 | -- | $269,790 | $33,377 | $236,413 |
Source: Public Records
Map
Nearby Homes
- 2701 Chiquita Blvd S
- 2717 Chiquita Blvd S
- 2607 Chiquita Blvd S
- 1518 SW 28th St
- 1502 SW 28th St
- 1426 SW 28th St
- 1323 SW 27th Terrace
- 2101 SW 26th Terrace
- 1605 SW 28th St
- 1517 SW 28th Terrace
- 2519 SW 15th Ave
- 2709 SW 13th Ave
- 623 SW 25th Ln
- 2708 SW 17th Ave Unit 31
- Plan 2169 at Cape Coral-South
- Plan 2265 at Cape Coral-South
- Plan 1755 at Cape Coral-South
- Plan 2010 at Cape Coral-South
- Plan 2117 at Cape Coral-South
- 1231 SW 28th Terrace
- 2613 SW 15th Ave
- 2609 SW 15th Ave
- 2703 SW 15th Ave
- 2614 SW 15th Ave
- 2618 SW 15th Ave
- 2700 SW 15th Ave
- 2605 SW 15th Ave
- 2606 SW 15th Ave Unit 66
- 1423 SW 27th Terrace
- 2615 SW 15th Place
- 2619 SW 15th Place
- 2601 SW 15th Ave
- 1417 SW 27th Terrace
- 2611 SW 15th Place
- 2611 SW 15th Ave
- 2602 SW 15th Ave
- 2701 SW 15th Place
- 2708 SW 15th Ave
- 2607 SW 15th Place
- 1413 SW 27th Terrace