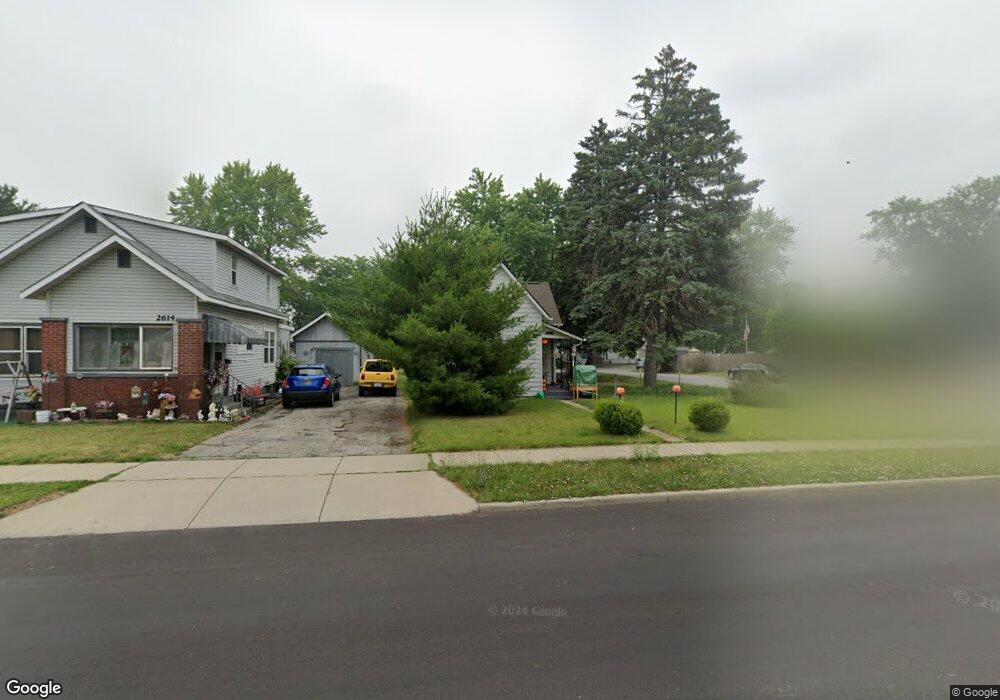
2618 Main St Lafayette, IN 47904
South Oakland NeighborhoodEstimated Value: $154,000 - $186,000
Studio
--
Bath
820
Sq Ft
$209/Sq Ft
Est. Value
About This Home
This home is located at 2618 Main St, Lafayette, IN 47904 and is currently estimated at $171,597, approximately $209 per square foot. 2618 Main St is a home located in Tippecanoe County with nearby schools including Oakland Elementary School, Sunnyside Intermediate School, and Lafayette Tecumseh Junior High School.
Ownership History
Date
Name
Owned For
Owner Type
Purchase Details
Closed on
Jul 24, 2003
Sold by
Buess Connie M and Miller Connie M
Bought by
Miller Kenneth S and Miller Connie M
Current Estimated Value
Home Financials for this Owner
Home Financials are based on the most recent Mortgage that was taken out on this home.
Original Mortgage
$58,000
Interest Rate
5.31%
Mortgage Type
Purchase Money Mortgage
Create a Home Valuation Report for This Property
The Home Valuation Report is an in-depth analysis detailing your home's value as well as a comparison with similar homes in the area
Home Values in the Area
Average Home Value in this Area
Purchase History
| Date | Buyer | Sale Price | Title Company |
|---|---|---|---|
| Miller Kenneth S | -- | Poelstra Title Company |
Source: Public Records
Mortgage History
| Date | Status | Borrower | Loan Amount |
|---|---|---|---|
| Closed | Miller Kenneth S | $58,000 |
Source: Public Records
Tax History
| Year | Tax Paid | Tax Assessment Tax Assessment Total Assessment is a certain percentage of the fair market value that is determined by local assessors to be the total taxable value of land and additions on the property. | Land | Improvement |
|---|---|---|---|---|
| 2024 | $905 | $118,200 | $18,000 | $100,200 |
| 2023 | $814 | $110,300 | $18,000 | $92,300 |
| 2022 | $855 | $100,700 | $18,000 | $82,700 |
| 2021 | $725 | $90,600 | $18,000 | $72,600 |
| 2020 | $595 | $83,300 | $18,000 | $65,300 |
| 2019 | $443 | $69,200 | $16,200 | $53,000 |
| 2018 | $431 | $67,000 | $16,200 | $50,800 |
| 2017 | $421 | $66,400 | $16,200 | $50,200 |
| 2016 | $363 | $62,600 | $16,200 | $46,400 |
| 2014 | $278 | $60,300 | $16,200 | $44,100 |
| 2013 | $262 | $58,200 | $16,200 | $42,000 |
Source: Public Records
Map
Nearby Homes
- 800 S 27th St
- 2515 Main St
- 807 S 30th St
- 637 Park Ave
- 621 S 26th St
- 619 S 29th St
- 1016 S 22nd St
- 626 S 31st St
- 807 S 20th St
- 1006 S 20th St
- 1120 S 20th St
- 112 S 28th St
- 1619 Virginia St
- 1710 Congress St
- 1524 Virginia St
- 1802 Thompson St
- 1429 Stanforth Ave
- 1226 Sinton Ave
- 22 N 30th St
- 1204 Central St
Your Personal Tour Guide
Ask me questions while you tour the home.