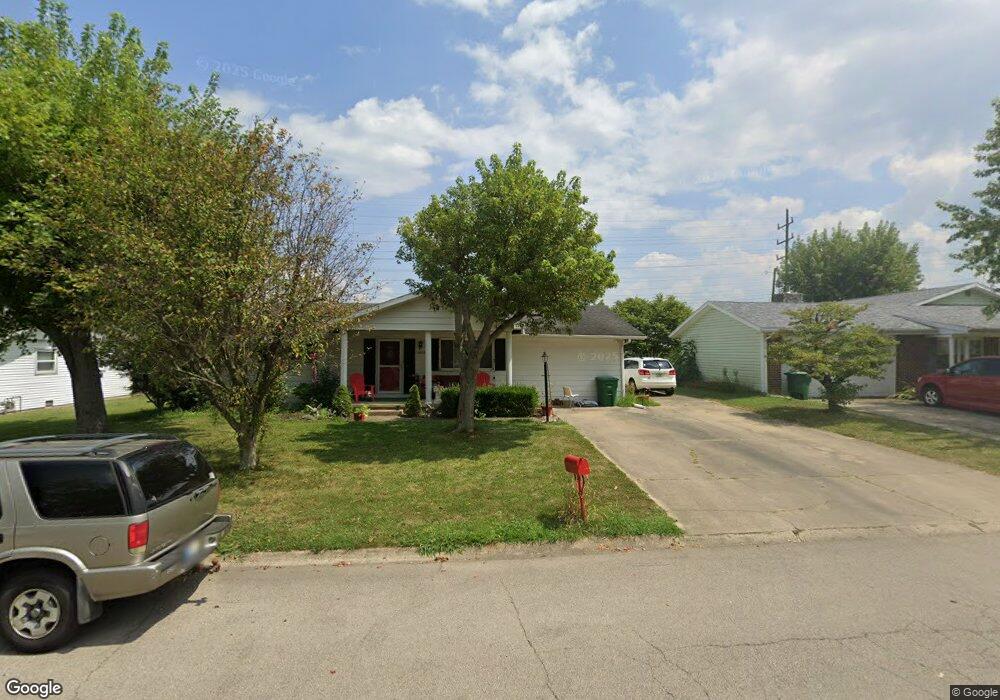
2618 Maple Dr New Castle, IN 47362
Estimated Value: $184,000 - $196,410
3
Beds
2
Baths
1,984
Sq Ft
$96/Sq Ft
Est. Value
About This Home
This home is located at 2618 Maple Dr, New Castle, IN 47362 and is currently estimated at $190,603, approximately $96 per square foot. 2618 Maple Dr is a home located in Henry County with nearby schools including Agape Learning Center.
Ownership History
Date
Name
Owned For
Owner Type
Purchase Details
Closed on
Mar 1, 2007
Sold by
National City Bank
Bought by
Aten Matthew A and Aten Angela D
Current Estimated Value
Home Financials for this Owner
Home Financials are based on the most recent Mortgage that was taken out on this home.
Original Mortgage
$69,646
Outstanding Balance
$42,179
Interest Rate
6.27%
Mortgage Type
FHA
Estimated Equity
$148,424
Purchase Details
Closed on
Oct 24, 2006
Sold by
Pentecost Brian M V and Pentecost Jeaneth Dawn
Bought by
National City Bank
Create a Home Valuation Report for This Property
The Home Valuation Report is an in-depth analysis detailing your home's value as well as a comparison with similar homes in the area
Home Values in the Area
Average Home Value in this Area
Purchase History
| Date | Buyer | Sale Price | Title Company |
|---|---|---|---|
| Aten Matthew A | -- | None Available | |
| National City Bank | $76,779 | None Available |
Source: Public Records
Mortgage History
| Date | Status | Borrower | Loan Amount |
|---|---|---|---|
| Open | Aten Matthew A | $69,646 |
Source: Public Records
Tax History
| Year | Tax Paid | Tax Assessment Tax Assessment Total Assessment is a certain percentage of the fair market value that is determined by local assessors to be the total taxable value of land and additions on the property. | Land | Improvement |
|---|---|---|---|---|
| 2024 | $1,356 | $135,600 | $25,300 | $110,300 |
| 2023 | $1,283 | $128,300 | $25,300 | $103,000 |
| 2022 | $1,016 | $101,800 | $16,800 | $85,000 |
| 2021 | $815 | $81,600 | $16,800 | $64,800 |
| 2020 | $837 | $79,200 | $16,800 | $62,400 |
| 2019 | $870 | $82,300 | $16,800 | $65,500 |
| 2018 | $908 | $81,800 | $18,700 | $63,100 |
| 2017 | $847 | $79,900 | $18,700 | $61,200 |
| 2016 | $832 | $78,600 | $18,700 | $59,900 |
| 2014 | $700 | $77,600 | $18,500 | $59,100 |
| 2013 | $700 | $77,200 | $18,900 | $58,300 |
Source: Public Records
Map
Nearby Homes
Your Personal Tour Guide
Ask me questions while you tour the home.