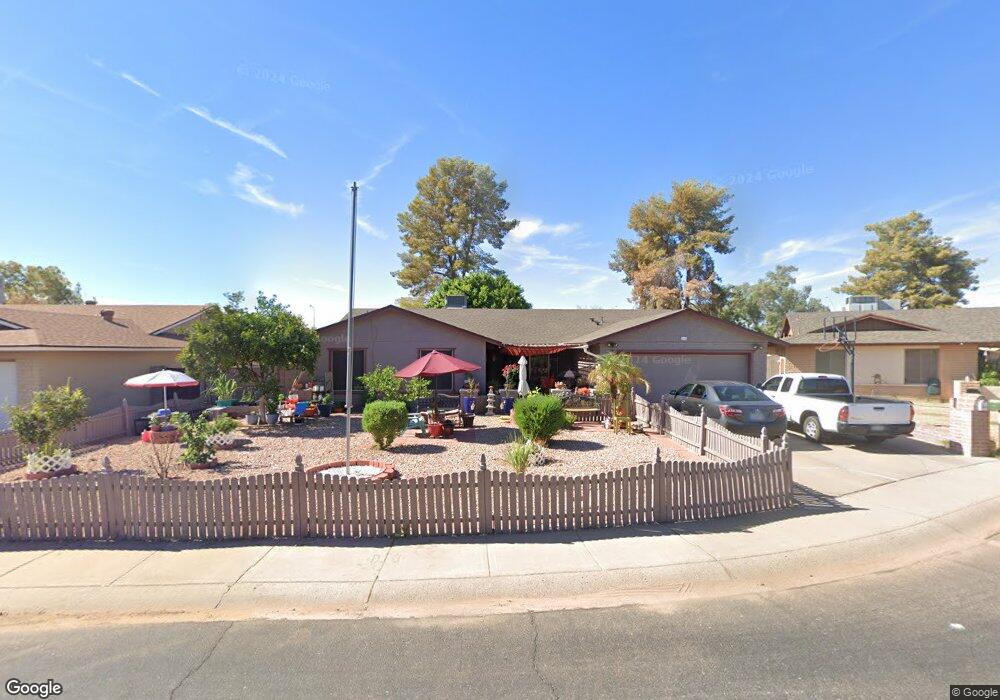
2618 N Pleasant Dr Chandler, AZ 85225
Amberwood NeighborhoodEstimated Value: $411,767 - $538,000
4
Beds
2
Baths
1,932
Sq Ft
$246/Sq Ft
Est. Value
About This Home
This home is located at 2618 N Pleasant Dr, Chandler, AZ 85225 and is currently estimated at $475,442, approximately $246 per square foot. 2618 N Pleasant Dr is a home located in Maricopa County with nearby schools including Sirrine Elementary School, Franklin at Brimhall Elementary School, and Summit Academy Elementary.
Ownership History
Date
Name
Owned For
Owner Type
Purchase Details
Closed on
Mar 27, 2017
Sold by
Vanvanle Ban Van and Dao Truc
Bought by
Vanvanle Ban Van and Dao Truc
Current Estimated Value
Purchase Details
Closed on
Jan 10, 2002
Sold by
Dao Truc
Bought by
Vanvanle Ban Van and Dao Truc
Home Financials for this Owner
Home Financials are based on the most recent Mortgage that was taken out on this home.
Original Mortgage
$105,400
Outstanding Balance
$43,286
Interest Rate
7.11%
Estimated Equity
$432,156
Purchase Details
Closed on
May 2, 2000
Sold by
Huynh Jimmy
Bought by
Dao Truc
Home Financials for this Owner
Home Financials are based on the most recent Mortgage that was taken out on this home.
Original Mortgage
$105,600
Interest Rate
8.22%
Mortgage Type
New Conventional
Purchase Details
Closed on
Aug 13, 1999
Sold by
Holmes Chrisandra J and Holmes Archie L
Bought by
Kenney Chrisandra I
Create a Home Valuation Report for This Property
The Home Valuation Report is an in-depth analysis detailing your home's value as well as a comparison with similar homes in the area
Home Values in the Area
Average Home Value in this Area
Purchase History
| Date | Buyer | Sale Price | Title Company |
|---|---|---|---|
| Vanvanle Ban Van | -- | None Available | |
| Vanvanle Ban Van | -- | Fidelity National Title | |
| Dao Truc | $132,000 | First American Title | |
| Kenney Chrisandra I | -- | -- |
Source: Public Records
Mortgage History
| Date | Status | Borrower | Loan Amount |
|---|---|---|---|
| Open | Vanvanle Ban Van | $105,400 | |
| Closed | Dao Truc | $105,600 |
Source: Public Records
Tax History Compared to Growth
Tax History
| Year | Tax Paid | Tax Assessment Tax Assessment Total Assessment is a certain percentage of the fair market value that is determined by local assessors to be the total taxable value of land and additions on the property. | Land | Improvement |
|---|---|---|---|---|
| 2025 | $1,463 | $17,158 | -- | -- |
| 2024 | $1,477 | $16,341 | -- | -- |
| 2023 | $1,477 | $33,750 | $6,750 | $27,000 |
| 2022 | $1,437 | $25,450 | $5,090 | $20,360 |
| 2021 | $1,445 | $23,400 | $4,680 | $18,720 |
| 2020 | $1,429 | $21,630 | $4,320 | $17,310 |
| 2019 | $1,316 | $20,110 | $4,020 | $16,090 |
| 2018 | $1,278 | $18,670 | $3,730 | $14,940 |
| 2017 | $1,228 | $17,510 | $3,500 | $14,010 |
| 2016 | $1,202 | $16,470 | $3,290 | $13,180 |
| 2015 | $1,131 | $14,550 | $2,910 | $11,640 |
Source: Public Records
Map
Nearby Homes
- 2609 N Pleasant Dr
- 916 W Loughlin Dr
- 2712 N Evergreen St
- 812 W Rosal Place
- 800 W Marlboro Dr
- 1203 W Alamo Dr
- 1224 W Mesquite St
- 3009 N Pleasant Dr
- 1309 W Marlboro Dr
- 1126 W Elliot Rd Unit 1040
- 1126 W Elliot Rd Unit 1010
- 2201 N Comanche Dr Unit 1080
- 2201 N Comanche Dr Unit 1104
- 2201 N Comanche Dr Unit 1018
- 2201 N Comanche Dr Unit 1002
- 792 W El Monte Place Unit 8
- 617 W Chilton St
- 898 W Sterling Place
- 1511 W Mesquite St
- 305 W Nopal Place
- 2616 N Pleasant Dr
- 2620 N Pleasant Dr
- 2614 N Pleasant Dr
- 924 W Loughlin Dr
- 2617 N Pleasant Dr
- 2615 N Pleasant Dr
- 922 W Loughlin Dr
- 2613 N Pleasant Dr
- 2612 N Pleasant Dr
- 921 W Cheyenne Dr Unit 2
- 919 W Loughlin Dr
- 920 W Loughlin Dr Unit 2
- 919 W Cheyenne Dr
- 917 W Cheyenne Dr
- 2712 N Karen Dr
- 916 W Mission Dr
- 2708 N Karen Dr
- 2716 N Karen Dr
- 2611 N Pleasant Dr Unit 2
- 2610 N Pleasant Dr Unit 2