Estimated Value: $210,000 - $226,044
2
Beds
1
Bath
819
Sq Ft
$264/Sq Ft
Est. Value
About This Home
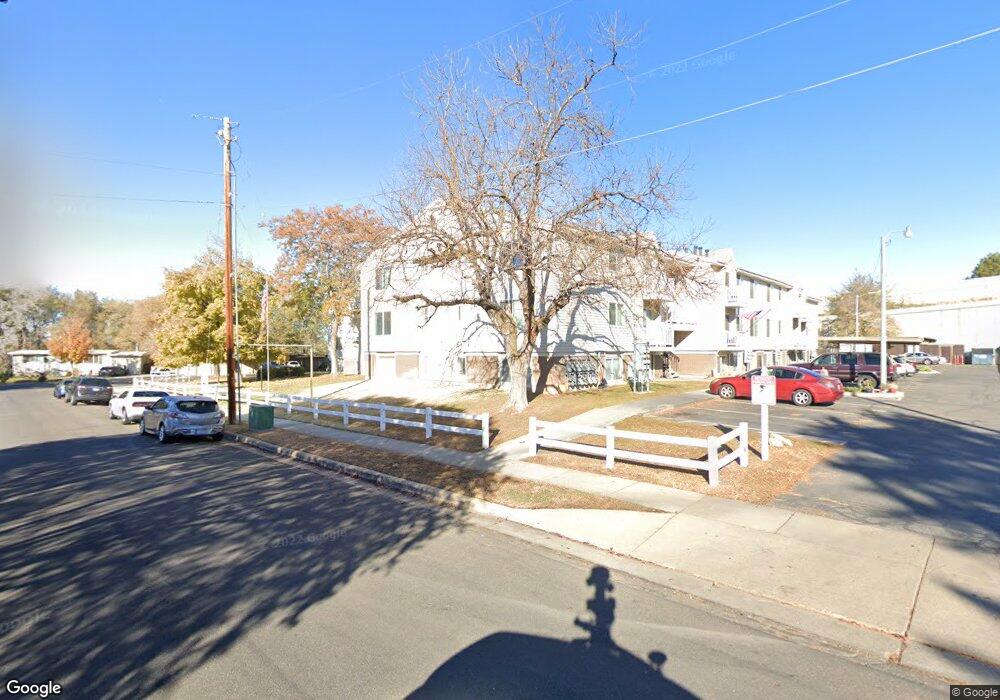
This home is located at 2618 W 5625 S Unit L2618, Roy, UT 84067 and is currently estimated at $216,261, approximately $264 per square foot. 2618 W 5625 S Unit L2618 is a home located in Weber County with nearby schools including Roy Elementary School, Roy Junior High School, and Roy High School.
Ownership History
Date
Name
Owned For
Owner Type
Purchase Details
Closed on
Jun 1, 2021
Sold by
Luck Joshua
Bought by
Webb Nathan Thomas
Current Estimated Value
Home Financials for this Owner
Home Financials are based on the most recent Mortgage that was taken out on this home.
Original Mortgage
$194,970
Outstanding Balance
$176,521
Interest Rate
2.9%
Mortgage Type
New Conventional
Estimated Equity
$39,740
Purchase Details
Closed on
Aug 20, 2019
Sold by
Jones Jack
Bought by
Luck Joshua
Home Financials for this Owner
Home Financials are based on the most recent Mortgage that was taken out on this home.
Original Mortgage
$5,000
Interest Rate
3.7%
Purchase Details
Closed on
Dec 7, 2000
Sold by
Moss Ronald L
Bought by
Bank Of Utah and Robert Ferry Trust
Create a Home Valuation Report for This Property
The Home Valuation Report is an in-depth analysis detailing your home's value as well as a comparison with similar homes in the area
Home Values in the Area
Average Home Value in this Area
Purchase History
| Date | Buyer | Sale Price | Title Company |
|---|---|---|---|
| Webb Nathan Thomas | -- | First American Title Ins Co | |
| Luck Joshua | -- | Us Title Insurance Agency | |
| Bank Of Utah | -- | Mountain View Title |
Source: Public Records
Mortgage History
| Date | Status | Borrower | Loan Amount |
|---|---|---|---|
| Open | Webb Nathan Thomas | $194,970 | |
| Previous Owner | Luck Joshua | $5,000 |
Source: Public Records
Tax History Compared to Growth
Tax History
| Year | Tax Paid | Tax Assessment Tax Assessment Total Assessment is a certain percentage of the fair market value that is determined by local assessors to be the total taxable value of land and additions on the property. | Land | Improvement |
|---|---|---|---|---|
| 2025 | $1,287 | $226,985 | $50,000 | $176,985 |
| 2024 | $1,244 | $121,550 | $27,500 | $94,050 |
| 2023 | $1,135 | $111,100 | $27,500 | $83,600 |
| 2022 | $1,164 | $116,050 | $27,500 | $88,550 |
| 2021 | $901 | $149,000 | $20,000 | $129,000 |
| 2020 | $832 | $126,000 | $20,000 | $106,000 |
| 2019 | $650 | $93,000 | $20,000 | $73,000 |
| 2018 | $562 | $76,000 | $10,000 | $66,000 |
| 2017 | $400 | $51,000 | $9,000 | $42,000 |
| 2016 | $384 | $26,400 | $5,500 | $20,900 |
| 2015 | $412 | $29,150 | $7,150 | $22,000 |
| 2014 | $417 | $29,150 | $7,150 | $22,000 |
Source: Public Records
Map
Nearby Homes
- 2646 W 5625 S Unit M-2646
- 2571 W 5725 S
- 2672 W 5750 S
- 2587 W 5750 S
- 5810 S 2550 W
- 2778 W 5550 S Unit 28
- 5568 S 2800 W Unit 5B
- 2786 W 5550 S Unit C11
- 2778 W 5400 S
- 5317 S 2690 W
- 5643 S 2200 W
- 5326 S 2675 W
- 2907 W 5775 S
- 5345 S 2425 W
- 2829 W 5925 S
- 2995 W 5750 S
- 5573 S 2150 W
- 2184 W 5500 S
- 2146 W 5600 S Unit 29
- 5545 S 2100 W Unit 12