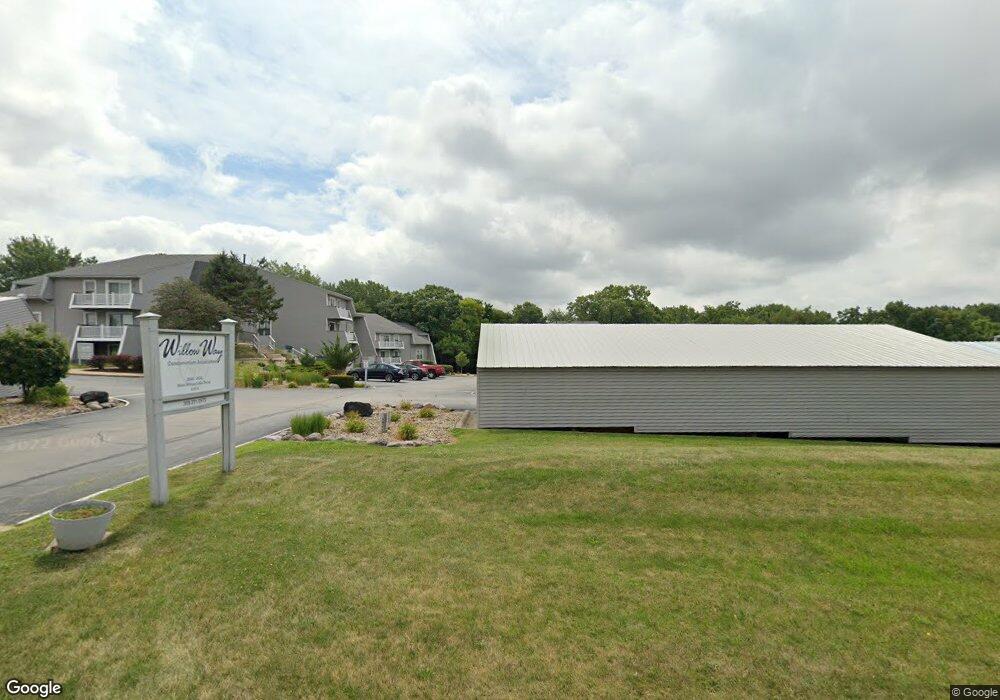
2618 W Willowlake Dr Unit 233 Peoria, IL 61614
North Peoria NeighborhoodEstimated Value: $60,000 - $83,000
1
Bed
1
Bath
818
Sq Ft
$86/Sq Ft
Est. Value
About This Home
This home is located at 2618 W Willowlake Dr Unit 233, Peoria, IL 61614 and is currently estimated at $70,584, approximately $86 per square foot. 2618 W Willowlake Dr Unit 233 is a home located in Peoria County with nearby schools including Ridgeview Elementary School, Dunlap Valley Middle School, and Dunlap High School.
Ownership History
Date
Name
Owned For
Owner Type
Purchase Details
Closed on
Jun 8, 2022
Sold by
Hcarter Investments Llc
Bought by
Drissi Amir
Current Estimated Value
Home Financials for this Owner
Home Financials are based on the most recent Mortgage that was taken out on this home.
Original Mortgage
$35,250
Outstanding Balance
$33,740
Interest Rate
5.99%
Mortgage Type
New Conventional
Estimated Equity
$36,844
Purchase Details
Closed on
Mar 2, 2021
Sold by
Harry A Carter Trust
Bought by
Hcarter Investments Llc
Purchase Details
Closed on
Aug 17, 2018
Sold by
Anisah Mirza
Bought by
Carter Harry A Trust
Purchase Details
Closed on
Aug 9, 2007
Bought by
Mirza Anisah
Create a Home Valuation Report for This Property
The Home Valuation Report is an in-depth analysis detailing your home's value as well as a comparison with similar homes in the area
Home Values in the Area
Average Home Value in this Area
Purchase History
| Date | Buyer | Sale Price | Title Company |
|---|---|---|---|
| Drissi Amir | $47,000 | Heyl Royster Voelker & Allen P | |
| Drissi Amir | $47,000 | Heyl Royster Voelker & Allen P | |
| Hcarter Investments Llc | -- | Taylor Law Offices Pc | |
| Carter Harry A Trust | $30,000 | Attorney Only | |
| Harry A Carter Trust | $30,000 | Cusack Gilfillan & Oday Llc | |
| Mirza Anisah | $45,500 | -- |
Source: Public Records
Mortgage History
| Date | Status | Borrower | Loan Amount |
|---|---|---|---|
| Open | Drissi Amir | $35,250 | |
| Closed | Drissi Amir | $35,250 |
Source: Public Records
Tax History Compared to Growth
Tax History
| Year | Tax Paid | Tax Assessment Tax Assessment Total Assessment is a certain percentage of the fair market value that is determined by local assessors to be the total taxable value of land and additions on the property. | Land | Improvement |
|---|---|---|---|---|
| 2024 | $1,549 | $18,140 | $1,780 | $16,360 |
| 2023 | $1,432 | $16,640 | $1,630 | $15,010 |
| 2022 | $1,145 | $13,200 | $1,420 | $11,780 |
| 2021 | $1,102 | $12,570 | $1,350 | $11,220 |
| 2020 | $1,101 | $12,450 | $1,340 | $11,110 |
| 2019 | $1,126 | $12,710 | $1,370 | $11,340 |
| 2018 | $879 | $10,000 | $1,390 | $8,610 |
| 2017 | $1,145 | $18,910 | $1,470 | $17,440 |
| 2016 | $1,129 | $18,910 | $1,470 | $17,440 |
| 2015 | $1,086 | $18,540 | $1,440 | $17,100 |
| 2014 | $1,084 | $17,590 | $1,360 | $16,230 |
| 2013 | -- | $17,810 | $1,380 | $16,430 |
Source: Public Records
Map
Nearby Homes
- 2605 W Willowlake Dr Unit 13
- 7223 N Lakeside Ct Unit 12
- 7217 N Lakeside Ct Unit 9
- 7133 N Terra Vista Dr Unit 3202
- 2407 W Cabana Ct
- 2315 W Madera Ct
- 6619 N Brookwood Ln
- 6616 N Greenmont Rd
- 6822 N Parkwood Dr
- 3207 W Willow Knolls Dr Unit 66C
- 3119 W Willow Knolls Dr Unit 25B
- 6500 N Allen Rd Unit 65
- 1925 W Courtside Dr Unit 15B
- 3129 W Birkshire Dr
- 6242 N Allen Rd Unit 6
- 6300 N Allen Rd Unit 12
- 6603 N Toronado Ct
- 2823 W Greenbrier Ln
- 3505 W Willow Knolls Dr Unit 3G
- Lot 3 N Mandalay Dr
- 2618 W Willowlake Dr
- 2618 W Willowlake Dr Unit 224
- 2618 W Willowlake Dr Unit 233
- 2618 W Willowlake Dr Unit 232
- 2618 W Willowlake Dr Unit 222
- 2618 W Willowlake Dr Unit 212
- 2618 W Willowlake Dr Unit 211
- 2618 W Willowlake Dr Unit 224
- 2618 W Willowlake Dr Unit 211
- 2618 W Willowlake Dr
- 2618 W Willowlake Dr Unit 234
- 2618 W Willowlake Dr Unit 321
- 2618 W Willowlake Dr Unit 234
- 2618 W Willowlake Dr
- 2618 W Willowlake Dr Unit 23
- 2622 W Willowlake Dr
- 2622 W Willowlake Dr Unit 333
- 2622 W Willowlake Dr Unit 332
- 2622 W Willowlake Dr Unit 324
- 2622 W Willowlake Dr Unit 323