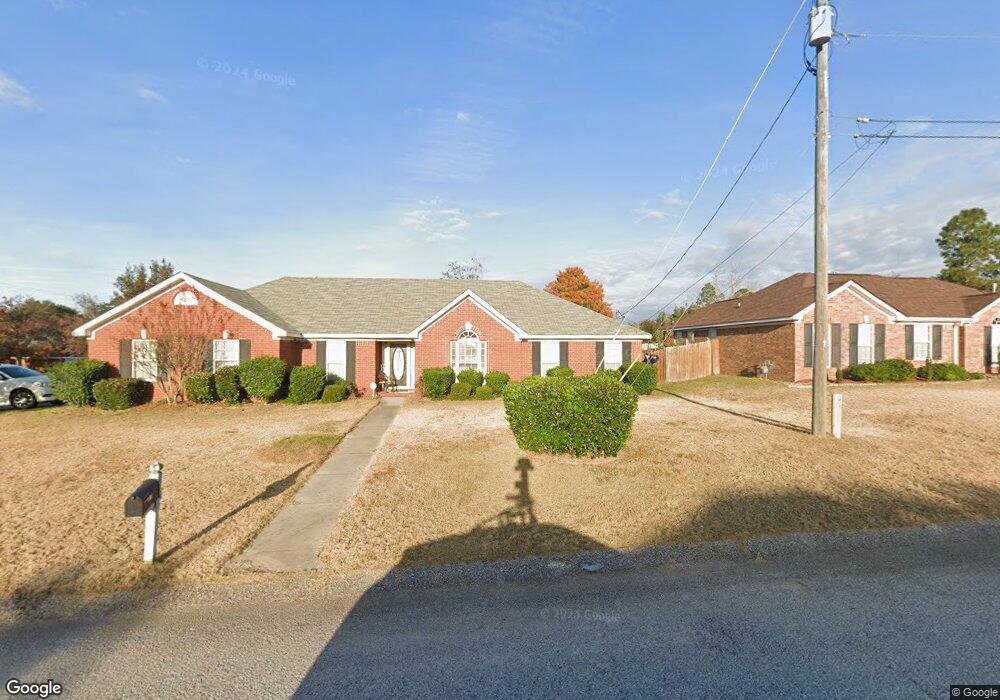
2619 Anacua Way Augusta, GA 30906
Pepperidge NeighborhoodEstimated Value: $237,000 - $259,000
4
Beds
2
Baths
2,069
Sq Ft
$118/Sq Ft
Est. Value
About This Home
This home is located at 2619 Anacua Way, Augusta, GA 30906 and is currently estimated at $244,896, approximately $118 per square foot. 2619 Anacua Way is a home located in Richmond County with nearby schools including Tobacco Road Elementary School, Richmond Hill K-8, and Johnson Magnet.
Ownership History
Date
Name
Owned For
Owner Type
Purchase Details
Closed on
Nov 4, 2009
Sold by
Clemons Dwayne R and Clemons Tonya J
Bought by
Patterson Smith
Current Estimated Value
Home Financials for this Owner
Home Financials are based on the most recent Mortgage that was taken out on this home.
Original Mortgage
$140,311
Outstanding Balance
$91,293
Interest Rate
5.01%
Mortgage Type
FHA
Estimated Equity
$153,603
Purchase Details
Closed on
Aug 23, 2002
Sold by
Nordahl Homes Inc
Bought by
Clemons Dwayne Roderick and Torbert Tonya Cornelia
Home Financials for this Owner
Home Financials are based on the most recent Mortgage that was taken out on this home.
Original Mortgage
$141,678
Interest Rate
6.4%
Mortgage Type
VA
Create a Home Valuation Report for This Property
The Home Valuation Report is an in-depth analysis detailing your home's value as well as a comparison with similar homes in the area
Home Values in the Area
Average Home Value in this Area
Purchase History
| Date | Buyer | Sale Price | Title Company |
|---|---|---|---|
| Patterson Smith | $143,000 | -- | |
| Clemons Dwayne Roderick | $138,900 | -- |
Source: Public Records
Mortgage History
| Date | Status | Borrower | Loan Amount |
|---|---|---|---|
| Open | Patterson Smith | $140,311 | |
| Previous Owner | Clemons Dwayne Roderick | $141,678 |
Source: Public Records
Tax History Compared to Growth
Tax History
| Year | Tax Paid | Tax Assessment Tax Assessment Total Assessment is a certain percentage of the fair market value that is determined by local assessors to be the total taxable value of land and additions on the property. | Land | Improvement |
|---|---|---|---|---|
| 2025 | $1,188 | $93,272 | $7,380 | $85,892 |
| 2024 | $1,188 | $96,652 | $7,380 | $89,272 |
| 2023 | $1,174 | $93,140 | $7,380 | $85,760 |
| 2022 | $1,211 | $83,762 | $7,380 | $76,382 |
| 2021 | $1,963 | $50,995 | $7,380 | $43,615 |
| 2020 | $1,933 | $50,995 | $7,380 | $43,615 |
| 2019 | $2,046 | $50,995 | $7,380 | $43,615 |
| 2018 | $2,056 | $50,895 | $7,380 | $43,515 |
| 2017 | $2,002 | $50,895 | $7,380 | $43,515 |
| 2016 | $1,988 | $50,436 | $7,380 | $43,056 |
| 2015 | $2,002 | $50,436 | $7,380 | $43,056 |
| 2014 | $2,004 | $50,436 | $7,380 | $43,056 |
Source: Public Records
Map
Nearby Homes
- 2423 Ramblewood Dr
- 2511 Smoketree Rd
- 4349 White Pines Ct
- 3545 Monte Carlo Dr
- 3346 Thames Place
- 3434 Thames Place
- 3436 Thames Place
- 3503 Greenwood Dr
- 2427 Faith Trail
- 2103 Pepperidge Dr
- 2110 Travis Rd
- 2219 Travis Rd
- 3640 Elliott Blvd
- 2113 Chadwick Rd
- 2204 Glynn Arven Ct
- 3611 Kentwood Dr Unit 1
- 3606 Greiner Dr
- 2115 Ashley Dr
- 2114 Rosier Rd
- 2114 Boykin Rd
- 2617 Anacua Way
- 2420 Ramblewood Dr
- 2418 Ramblewood Dr
- 2615 Anacua Way
- 2549 Smoketree Rd
- 2551 Smoketree Rd
- 2620 Anacua Way
- 2416 Ramblewood Dr
- 2618 Anacua Way
- 2553 Smoketree Rd
- 2613 Anacua Way
- 2545 Smoketree Rd
- 2616 Anacua Way
- 2414 Ramblewood Dr
- 2555 Smoketree Rd
- 2611 Anacua Way
- 2719 Tallowtree St
- 2614 Anacua Way
- 2421 Ramblewood Dr
- 2557 Smoketree Rd