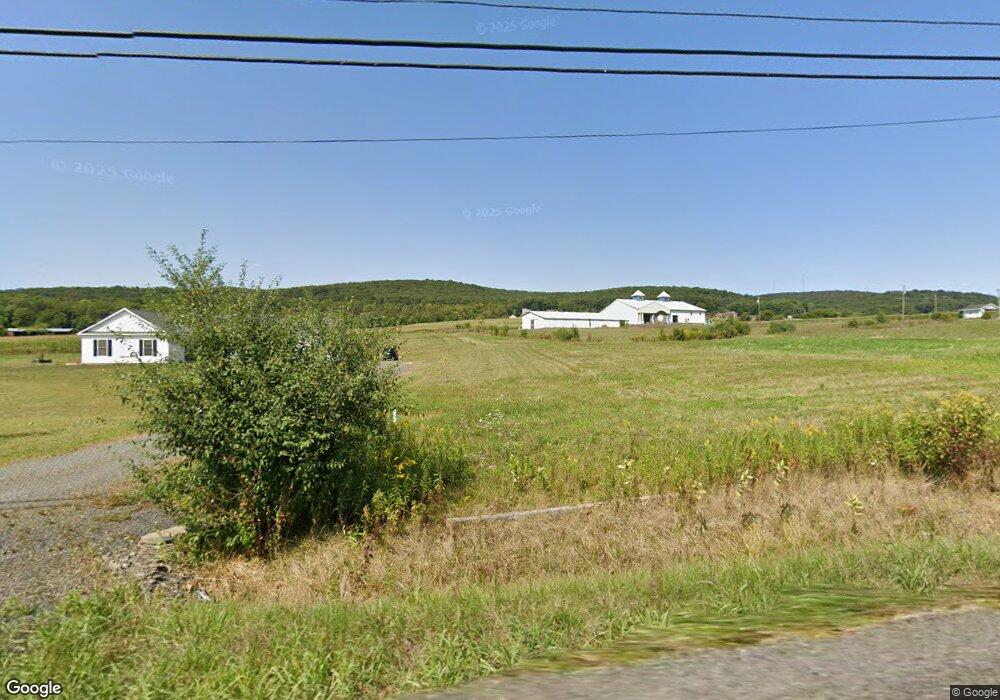
2619 Bloom Rd Danville, PA 17821
Estimated Value: $197,000 - $302,000
3
Beds
2
Baths
2,116
Sq Ft
$124/Sq Ft
Est. Value
About This Home
This home is located at 2619 Bloom Rd, Danville, PA 17821 and is currently estimated at $261,682, approximately $123 per square foot. 2619 Bloom Rd is a home located in Montour County with nearby schools including Danville Primary School, Liberty-Valley Elementary School, and Danville Area Middle School.
Ownership History
Date
Name
Owned For
Owner Type
Purchase Details
Closed on
Nov 7, 2006
Sold by
Geringer Scott A and Carter Sheryl A
Bought by
Geringer Scott A
Current Estimated Value
Home Financials for this Owner
Home Financials are based on the most recent Mortgage that was taken out on this home.
Original Mortgage
$96,000
Outstanding Balance
$56,078
Interest Rate
5.99%
Mortgage Type
Adjustable Rate Mortgage/ARM
Estimated Equity
$205,604
Create a Home Valuation Report for This Property
The Home Valuation Report is an in-depth analysis detailing your home's value as well as a comparison with similar homes in the area
Home Values in the Area
Average Home Value in this Area
Purchase History
| Date | Buyer | Sale Price | Title Company |
|---|---|---|---|
| Geringer Scott A | $46,050 | None Available |
Source: Public Records
Mortgage History
| Date | Status | Borrower | Loan Amount |
|---|---|---|---|
| Open | Geringer Scott A | $96,000 |
Source: Public Records
Tax History Compared to Growth
Tax History
| Year | Tax Paid | Tax Assessment Tax Assessment Total Assessment is a certain percentage of the fair market value that is determined by local assessors to be the total taxable value of land and additions on the property. | Land | Improvement |
|---|---|---|---|---|
| 2025 | $1,824 | $108,200 | $28,200 | $80,000 |
| 2024 | $1,762 | $108,200 | $28,200 | $80,000 |
| 2023 | $1,762 | $108,200 | $28,200 | $80,000 |
| 2022 | $1,708 | $108,200 | $28,200 | $80,000 |
| 2021 | $1,667 | $108,200 | $28,200 | $80,000 |
| 2020 | $1,651 | $108,200 | $28,200 | $80,000 |
| 2019 | $1,599 | $108,200 | $28,200 | $80,000 |
| 2018 | $1,617 | $112,300 | $32,400 | $79,900 |
| 2017 | $1,619 | $112,300 | $32,400 | $79,900 |
| 2016 | $1,610 | $112,300 | $32,400 | $79,900 |
| 2015 | $431 | $112,300 | $32,400 | $79,900 |
| 2014 | -- | $112,300 | $32,400 | $79,900 |
Source: Public Records
Map
Nearby Homes