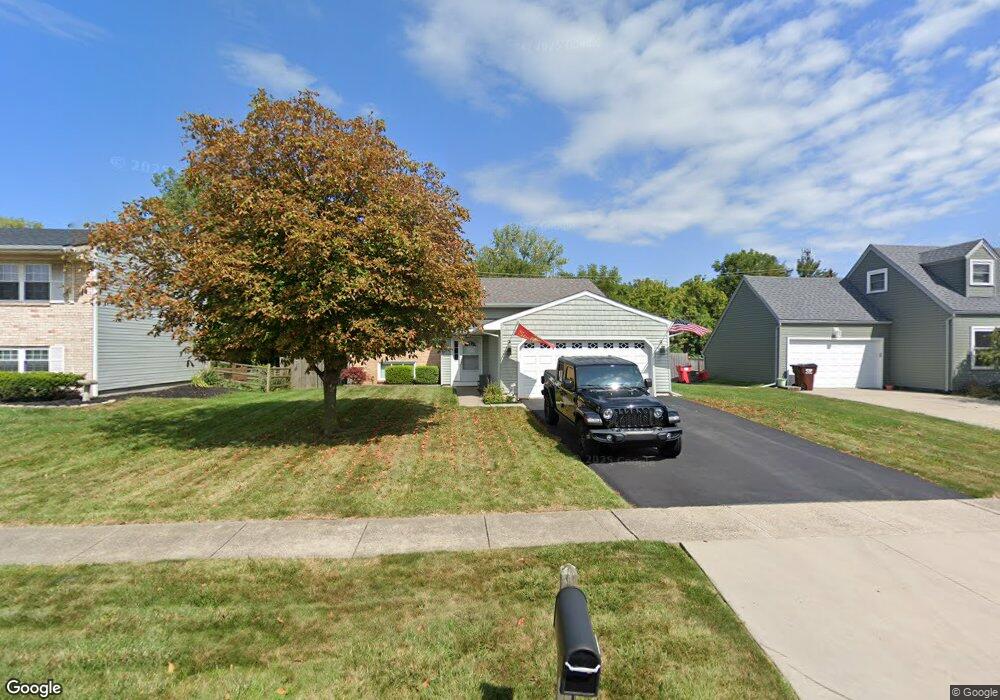
2619 Coveview Dr Toledo, OH 43611
Shoreland NeighborhoodEstimated Value: $236,000 - $290,000
3
Beds
2
Baths
2,155
Sq Ft
$124/Sq Ft
Est. Value
About This Home
This home is located at 2619 Coveview Dr, Toledo, OH 43611 and is currently estimated at $267,016, approximately $123 per square foot. 2619 Coveview Dr is a home located in Lucas County with nearby schools including Shoreland Elementary School, Washington Junior High School, and Jefferson Junior High School.
Ownership History
Date
Name
Owned For
Owner Type
Purchase Details
Closed on
Sep 5, 2017
Sold by
Vandercook Daniel R and Vandercook Stacy L
Bought by
Vandercook Daniel R and Vandercook Stacy L
Current Estimated Value
Home Financials for this Owner
Home Financials are based on the most recent Mortgage that was taken out on this home.
Original Mortgage
$132,057
Outstanding Balance
$110,158
Interest Rate
3.86%
Mortgage Type
VA
Estimated Equity
$156,858
Purchase Details
Closed on
May 10, 2011
Sold by
Kroncke Jeneane and Kroncke Jeneane L
Bought by
Vandercook Daniel R
Home Financials for this Owner
Home Financials are based on the most recent Mortgage that was taken out on this home.
Original Mortgage
$133,257
Interest Rate
4.88%
Mortgage Type
VA
Purchase Details
Closed on
Nov 10, 1992
Sold by
Kroncke Dean L
Purchase Details
Closed on
Sep 7, 1988
Sold by
Bowman Jeffrey Thomas
Create a Home Valuation Report for This Property
The Home Valuation Report is an in-depth analysis detailing your home's value as well as a comparison with similar homes in the area
Home Values in the Area
Average Home Value in this Area
Purchase History
| Date | Buyer | Sale Price | Title Company |
|---|---|---|---|
| Vandercook Daniel R | -- | Vantage Point Title | |
| Vandercook Daniel R | $130,000 | Attorney | |
| -- | -- | -- | |
| -- | $80,000 | -- |
Source: Public Records
Mortgage History
| Date | Status | Borrower | Loan Amount |
|---|---|---|---|
| Open | Vandercook Daniel R | $132,057 | |
| Closed | Vandercook Daniel R | $133,257 |
Source: Public Records
Tax History Compared to Growth
Tax History
| Year | Tax Paid | Tax Assessment Tax Assessment Total Assessment is a certain percentage of the fair market value that is determined by local assessors to be the total taxable value of land and additions on the property. | Land | Improvement |
|---|---|---|---|---|
| 2024 | $2,736 | $78,295 | $9,660 | $68,635 |
| 2023 | $4,683 | $55,930 | $7,490 | $48,440 |
| 2022 | $4,677 | $55,930 | $7,490 | $48,440 |
| 2021 | $4,682 | $55,930 | $7,490 | $48,440 |
| 2020 | $4,417 | $45,465 | $6,195 | $39,270 |
| 2019 | $4,324 | $45,465 | $6,195 | $39,270 |
| 2018 | $3,903 | $45,465 | $6,195 | $39,270 |
| 2017 | $3,868 | $40,985 | $5,390 | $35,595 |
| 2016 | $3,824 | $117,100 | $15,400 | $101,700 |
| 2015 | $3,808 | $117,100 | $15,400 | $101,700 |
| 2014 | $3,366 | $40,990 | $5,390 | $35,600 |
| 2013 | $3,366 | $40,990 | $5,390 | $35,600 |
Source: Public Records
Map
Nearby Homes
- 2545 Woodfox Dr
- 2913 Capri Dr
- 6143 Randon Dr
- 6205 Windamar Rd
- 6337 Raymar St
- 6005 Bahiamar Rd
- 5531 Ottawa River Rd
- 5542 N Summit St
- 5414 Fortune Dr
- 2403 Shoreland Ave
- 3041 135th St
- 5415 302nd St
- 5433 Brophy Dr
- 6233 Grandview Dr
- 5618 Edgewater Dr
- 5338 305th St
- 5220 302nd St
- 3045 129th St
- 2642 124th St
- 3146 131st St
- 2625 Coveview Dr
- 2611 Coveview Dr
- 2631 Coveview Dr
- 2605 Coveview Dr
- 2618 Coveview Dr
- 2624 Coveview Dr
- 2565 Coveview Dr
- 2637 Coveview Dr
- 2612 Coveview Dr
- 2630 Coveview Dr
- 2606 Coveview Dr
- 2636 Coveview Dr
- 2559 Coveview Dr
- 2566 Coveview Dr
- 2644 Coveview Dr
- 2617 Point Pleasant Way
- 2653 Coveview Dr
- 2625 Point Pleasant Way
- 6051 Bridgeview Dr
- 2611 Point Pleasant Way