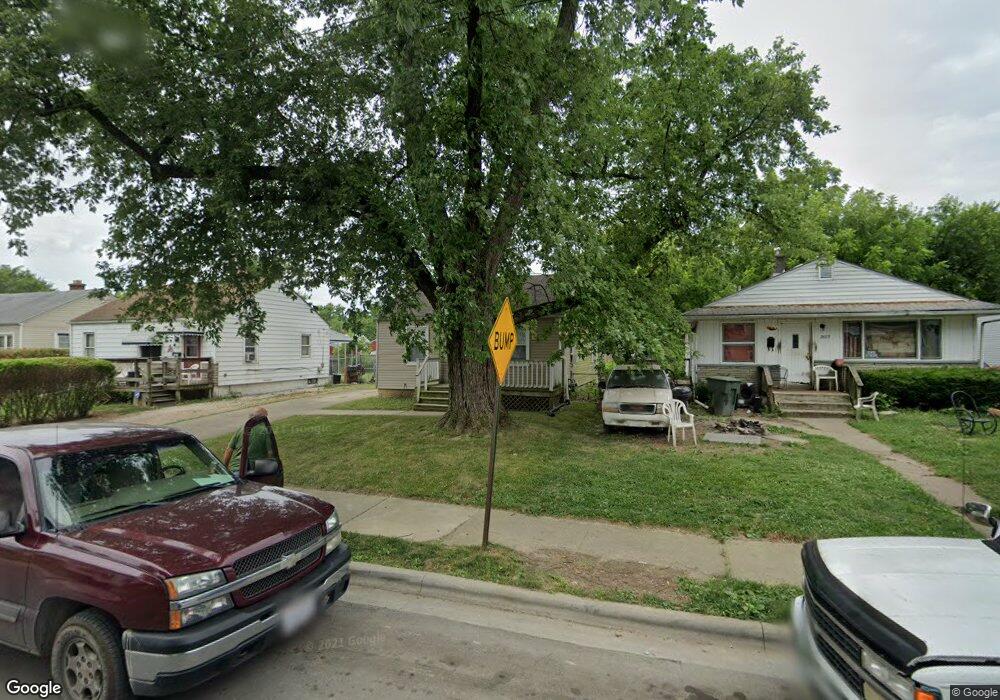
2619 Osceola Ave Columbus, OH 43211
North Linden NeighborhoodEstimated Value: $119,435 - $168,000
2
Beds
1
Bath
720
Sq Ft
$191/Sq Ft
Est. Value
About This Home
This home is located at 2619 Osceola Ave, Columbus, OH 43211 and is currently estimated at $137,609, approximately $191 per square foot. 2619 Osceola Ave is a home located in Franklin County with nearby schools including Como Elementary School, Dominion Middle School, and Whetstone High School.
Ownership History
Date
Name
Owned For
Owner Type
Purchase Details
Closed on
Apr 12, 2011
Sold by
Fannie Mae
Bought by
Straight Edward N
Current Estimated Value
Purchase Details
Closed on
Dec 28, 2010
Sold by
Scott Nia D
Bought by
Federal National Mortgage Association
Purchase Details
Closed on
May 9, 2006
Sold by
Trubiano Jerry
Bought by
Scott Nia D
Home Financials for this Owner
Home Financials are based on the most recent Mortgage that was taken out on this home.
Original Mortgage
$56,000
Interest Rate
6.54%
Mortgage Type
Fannie Mae Freddie Mac
Purchase Details
Closed on
Nov 17, 1999
Sold by
Schumacher Linda D
Bought by
Trubiano Jerry
Purchase Details
Closed on
Nov 14, 1997
Sold by
Strahm Ted W and Bixenman John A
Bought by
Schumacher Linda D
Home Financials for this Owner
Home Financials are based on the most recent Mortgage that was taken out on this home.
Original Mortgage
$40,750
Interest Rate
7.62%
Purchase Details
Closed on
Feb 6, 1997
Sold by
Strahm Ted W
Bought by
Bixenman Ted W Strahm and Bixenman John A
Create a Home Valuation Report for This Property
The Home Valuation Report is an in-depth analysis detailing your home's value as well as a comparison with similar homes in the area
Home Values in the Area
Average Home Value in this Area
Purchase History
| Date | Buyer | Sale Price | Title Company |
|---|---|---|---|
| Straight Edward N | $8,000 | Ohio Title | |
| Federal National Mortgage Association | $20,000 | Attorney | |
| Scott Nia D | $56,000 | Preferred T | |
| Trubiano Jerry | $49,400 | Stewart Title Agency Of Ohio | |
| Schumacher Linda D | $45,300 | Transohio Title | |
| Bixenman Ted W Strahm | $21,000 | -- |
Source: Public Records
Mortgage History
| Date | Status | Borrower | Loan Amount |
|---|---|---|---|
| Previous Owner | Scott Nia D | $56,000 | |
| Previous Owner | Schumacher Linda D | $40,750 |
Source: Public Records
Tax History Compared to Growth
Tax History
| Year | Tax Paid | Tax Assessment Tax Assessment Total Assessment is a certain percentage of the fair market value that is determined by local assessors to be the total taxable value of land and additions on the property. | Land | Improvement |
|---|---|---|---|---|
| 2024 | $3,067 | $34,230 | $9,030 | $25,200 |
| 2023 | $1,549 | $34,230 | $9,030 | $25,200 |
| 2022 | $2,261 | $19,010 | $4,730 | $14,280 |
| 2021 | $1,012 | $19,010 | $4,730 | $14,280 |
| 2020 | $1,014 | $19,010 | $4,730 | $14,280 |
| 2019 | $999 | $16,070 | $4,130 | $11,940 |
| 2018 | $932 | $16,070 | $4,130 | $11,940 |
| 2017 | $999 | $16,070 | $4,130 | $11,940 |
| 2016 | $952 | $14,010 | $3,470 | $10,540 |
| 2015 | $867 | $14,010 | $3,470 | $10,540 |
| 2014 | $869 | $14,010 | $3,470 | $10,540 |
| 2013 | $503 | $16,450 | $4,060 | $12,390 |
Source: Public Records
Map
Nearby Homes
- 2623 Audubon Rd
- 2661 Osceola Ave
- 2495 Pontiac St
- 2544 Azelda St
- 2725 Homecroft Dr
- 2751 Pontiac St
- 2487 Azelda St
- 2765 Pontiac St
- 2767 Hiawatha St
- 2810-2812 Azelda St
- 2389 Hiawatha Park Dr Unit 391
- 2816 Azelda St
- 2383 Hiawatha Park Dr Unit 2385
- 2654 Howey Rd
- 775 E Weber Rd
- 2595 Grasmere Ave
- 2390 Atwood Terrace
- 2352 Hiawatha Park Dr
- 2634 Grasmere Ave
- 2783 Howey Rd
- 2623 Osceola Ave
- 2613 Osceola Ave
- 2609 Osceola Ave
- 2629 Osceola Ave
- 2603 Osceola Ave
- 2626 Audubon Rd
- 2622 Audubon Rd
- 2632 Audubon Rd
- 2597 Osceola Ave
- 2616 Audubon Rd
- 2636 Audubon Rd
- 2618 Osceola Ave
- 2624 Osceola Ave
- 2614 Osceola Ave
- 2641 Osceola Ave
- 2610 Audubon Rd
- 2628 Osceola Ave
- 2608 Osceola Ave
- 2642 Audubon Rd
- 2593 Osceola Ave