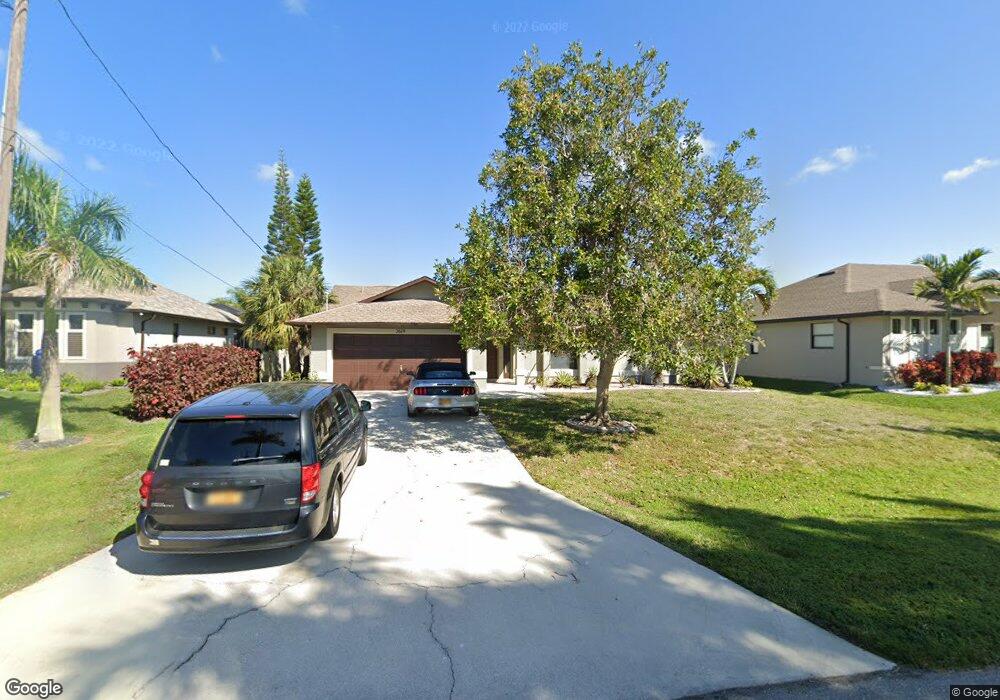
2619 SW 48th Terrace Unit 35 Cape Coral, FL 33914
Pelican NeighborhoodEstimated Value: $452,113 - $472,000
3
Beds
2
Baths
1,862
Sq Ft
$250/Sq Ft
Est. Value
About This Home
This home is located at 2619 SW 48th Terrace Unit 35, Cape Coral, FL 33914 and is currently estimated at $465,278, approximately $249 per square foot. 2619 SW 48th Terrace Unit 35 is a home located in Lee County with nearby schools including Cape Elementary School, Caloosa Elementary School, and Tropic Isles Elementary School.
Ownership History
Date
Name
Owned For
Owner Type
Purchase Details
Closed on
Aug 7, 2025
Sold by
Oppedisano Samuel J and Oppedisano Sharon
Bought by
Aglione Danilo and Pica Michael
Current Estimated Value
Home Financials for this Owner
Home Financials are based on the most recent Mortgage that was taken out on this home.
Original Mortgage
$426,600
Outstanding Balance
$426,234
Interest Rate
6.77%
Mortgage Type
New Conventional
Estimated Equity
$39,044
Purchase Details
Closed on
Jul 29, 2014
Sold by
Williams Jacqueline L and Williams Clifton A
Bought by
Oppedisano Samuel J and Oppedisano Sharon
Home Financials for this Owner
Home Financials are based on the most recent Mortgage that was taken out on this home.
Original Mortgage
$120,600
Interest Rate
4.19%
Mortgage Type
New Conventional
Create a Home Valuation Report for This Property
The Home Valuation Report is an in-depth analysis detailing your home's value as well as a comparison with similar homes in the area
Home Values in the Area
Average Home Value in this Area
Purchase History
| Date | Buyer | Sale Price | Title Company |
|---|---|---|---|
| Aglione Danilo | $474,000 | Assured Title Services | |
| Oppedisano Samuel J | $134,000 | Title Professionals |
Source: Public Records
Mortgage History
| Date | Status | Borrower | Loan Amount |
|---|---|---|---|
| Open | Aglione Danilo | $426,600 | |
| Previous Owner | Oppedisano Samuel J | $120,600 |
Source: Public Records
Tax History Compared to Growth
Tax History
| Year | Tax Paid | Tax Assessment Tax Assessment Total Assessment is a certain percentage of the fair market value that is determined by local assessors to be the total taxable value of land and additions on the property. | Land | Improvement |
|---|---|---|---|---|
| 2025 | $6,042 | $340,200 | $88,825 | $181,364 |
| 2024 | $6,042 | $316,102 | -- | -- |
| 2023 | $4,525 | $212,612 | $0 | $0 |
| 2022 | $4,033 | $193,284 | $0 | $0 |
| 2021 | $3,738 | $175,713 | $52,000 | $123,713 |
| 2020 | $3,793 | $159,891 | $50,000 | $109,891 |
| 2019 | $3,933 | $161,494 | $49,000 | $112,494 |
| 2018 | $3,819 | $150,997 | $40,500 | $110,497 |
| 2017 | $3,932 | $153,434 | $45,000 | $108,434 |
| 2016 | $3,745 | $142,066 | $45,000 | $97,066 |
| 2015 | $3,706 | $134,297 | $40,300 | $93,997 |
| 2014 | -- | $119,893 | $32,000 | $87,893 |
| 2013 | -- | $111,510 | $19,500 | $92,010 |
Source: Public Records
Map
Nearby Homes
- 4714 SW 25th Ct
- 2622 SW 46th Terrace
- 2521 Cape Coral Pkwy W
- 2610 SW 46th Terrace
- 4918 SW 27th Ave
- 2809 Cape Coral Pkwy W
- 2615 SW 46th Terrace
- 4833 SW 25th Place
- 4709 SW 25th Place
- 5003 SW 26th Ave
- 2417 Cape Coral Pkwy W
- 2812 SW 46th Terrace
- 2419 Cape Coral Pkwy W
- 3000 Sunset Pointe Cir
- 4809 SW 24th Place
- 4800 SW 24th Ave
- 4816 SW 24th Ave
- 4728 SW 24th Ave
- 5019 SW 25th Ct
- 4821 SW 29th Ave
- 2615 SW 48th Terrace
- 2623 SW 48th Terrace
- 2620 Cape Coral Pkwy W
- 2627 SW 48th Terrace
- 2616 Cape Coral Pkwy W
- 2620 SW 48th Terrace
- 2624 SW 48th Terrace
- 2616 SW 48th Terrace
- 2628 Cape Coral Pkwy W
- 2612 Cape Coral Pkwy W
- 2631 SW 48th Terrace
- 2628 SW 48th Terrace
- 2607 SW 48th Terrace
- 2612 SW 48th Terrace
- 2608 Cape Coral Pkwy W
- 2702 Cape Coral Pkwy W Unit 72
- 2632 SW 48th Terrace
- 2703 SW 48th Terrace
- 2608 SW 48th Terrace
- 2704 SW 48th Terrace