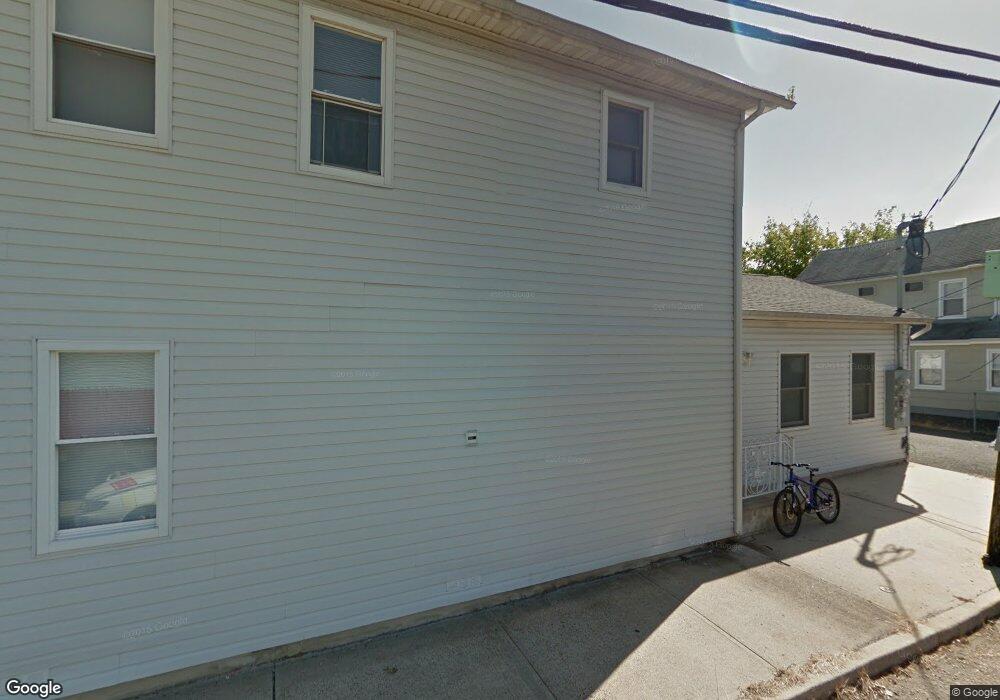
262 1st St Unit B & C Keyport, NJ 07735
Estimated Value: $885,932
6
Beds
5
Baths
4,146
Sq Ft
$214/Sq Ft
Est. Value
About This Home
This home is located at 262 1st St Unit B & C, Keyport, NJ 07735 and is currently estimated at $885,932, approximately $213 per square foot. 262 1st St Unit B & C is a home located in Monmouth County with nearby schools including Keyport Central School, Keyport High School, and Icob Academy.
Ownership History
Date
Name
Owned For
Owner Type
Purchase Details
Closed on
Apr 8, 2022
Sold by
John Morin
Bought by
Nica Nica Llc
Current Estimated Value
Home Financials for this Owner
Home Financials are based on the most recent Mortgage that was taken out on this home.
Original Mortgage
$500,000
Outstanding Balance
$467,635
Interest Rate
3.85%
Mortgage Type
New Conventional
Estimated Equity
$418,297
Purchase Details
Closed on
Sep 23, 2014
Sold by
Dalaridis Anezza and Dalaridis Peter
Bought by
Morin John
Home Financials for this Owner
Home Financials are based on the most recent Mortgage that was taken out on this home.
Original Mortgage
$243,750
Interest Rate
4.1%
Mortgage Type
Commercial
Purchase Details
Closed on
Dec 28, 2001
Sold by
Goddard Russell
Bought by
Dalaridis Anezza
Create a Home Valuation Report for This Property
The Home Valuation Report is an in-depth analysis detailing your home's value as well as a comparison with similar homes in the area
Home Values in the Area
Average Home Value in this Area
Purchase History
| Date | Buyer | Sale Price | Title Company |
|---|---|---|---|
| Nica Nica Llc | $700,000 | Trident Abstract Title | |
| Nica Nica Llc | $700,000 | Trident Abstract Title | |
| Morin John | $325,000 | None Available | |
| Dalaridis Anezza | $110,000 | -- |
Source: Public Records
Mortgage History
| Date | Status | Borrower | Loan Amount |
|---|---|---|---|
| Open | Nica Nica Llc | $500,000 | |
| Closed | Nica Nica Llc | $500,000 | |
| Previous Owner | Morin John | $243,750 |
Source: Public Records
Tax History Compared to Growth
Tax History
| Year | Tax Paid | Tax Assessment Tax Assessment Total Assessment is a certain percentage of the fair market value that is determined by local assessors to be the total taxable value of land and additions on the property. | Land | Improvement |
|---|---|---|---|---|
| 2025 | $14,045 | $744,200 | $196,100 | $548,100 |
| 2024 | $13,962 | $678,500 | $157,400 | $521,100 |
| 2023 | $13,962 | $635,200 | $143,100 | $492,100 |
| 2022 | $11,769 | $525,400 | $124,400 | $401,000 |
| 2021 | $11,769 | $466,300 | $108,200 | $358,100 |
| 2020 | $11,263 | $442,900 | $102,300 | $340,600 |
| 2019 | $10,958 | $431,600 | $98,800 | $332,800 |
| 2018 | $10,460 | $402,300 | $90,900 | $311,400 |
| 2017 | $10,462 | $401,300 | $93,800 | $307,500 |
| 2016 | $9,859 | $381,400 | $93,800 | $287,600 |
| 2015 | $9,676 | $372,600 | $88,800 | $283,800 |
| 2014 | $10,237 | $398,000 | $63,800 | $334,200 |
Source: Public Records
Map
Nearby Homes