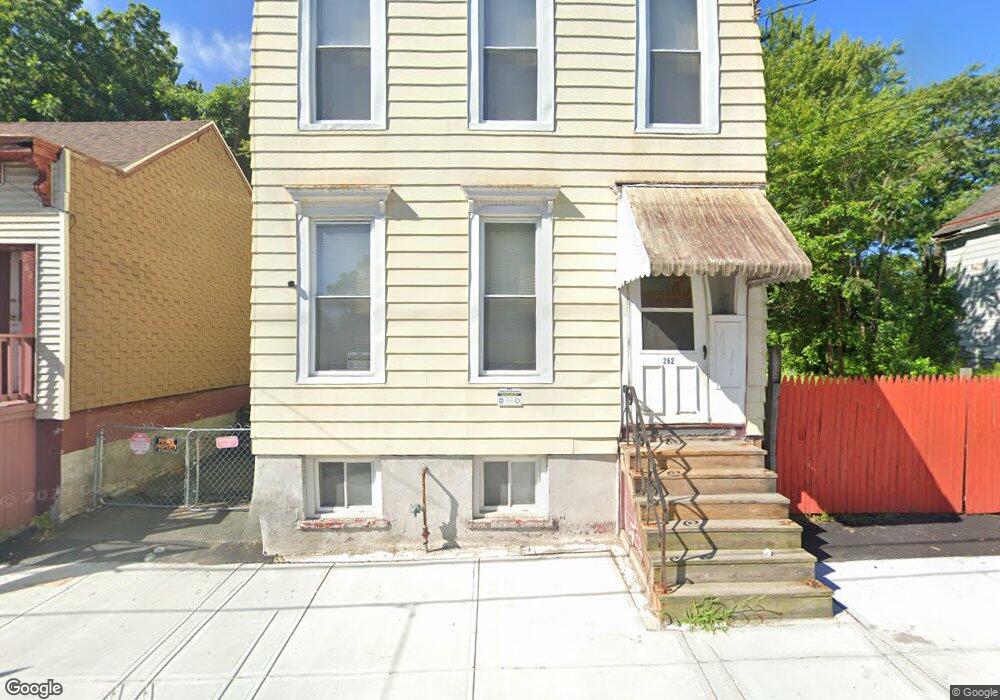
262 3rd St Albany, NY 12206
West Hill NeighborhoodEstimated Value: $104,571 - $176,000
4
Beds
2
Baths
1,200
Sq Ft
$118/Sq Ft
Est. Value
About This Home
This home is located at 262 3rd St, Albany, NY 12206 and is currently estimated at $142,143, approximately $118 per square foot. 262 3rd St is a home located in Albany County with nearby schools including Sheridan Preparatory Academy, Stephen And Harriet Myers Middle School, and Albany High School.
Ownership History
Date
Name
Owned For
Owner Type
Purchase Details
Closed on
Jan 6, 2005
Sold by
Lafayette Alice
Bought by
Ballou Joann
Current Estimated Value
Home Financials for this Owner
Home Financials are based on the most recent Mortgage that was taken out on this home.
Original Mortgage
$54,000
Outstanding Balance
$27,119
Interest Rate
5.67%
Mortgage Type
Unknown
Estimated Equity
$115,024
Create a Home Valuation Report for This Property
The Home Valuation Report is an in-depth analysis detailing your home's value as well as a comparison with similar homes in the area
Home Values in the Area
Average Home Value in this Area
Purchase History
| Date | Buyer | Sale Price | Title Company |
|---|---|---|---|
| Ballou Joann | $60,000 | Zappone & Fiore Law Firm |
Source: Public Records
Mortgage History
| Date | Status | Borrower | Loan Amount |
|---|---|---|---|
| Open | Ballou Joann | $54,000 | |
| Closed | Ballou Joann | $6,000 |
Source: Public Records
Tax History
| Year | Tax Paid | Tax Assessment Tax Assessment Total Assessment is a certain percentage of the fair market value that is determined by local assessors to be the total taxable value of land and additions on the property. | Land | Improvement |
|---|---|---|---|---|
| 2024 | $1,426 | $67,000 | $13,400 | $53,600 |
| 2023 | $2,414 | $70,000 | $14,000 | $56,000 |
| 2022 | $2,287 | $70,000 | $14,000 | $56,000 |
| 2021 | $2,257 | $70,000 | $14,000 | $56,000 |
| 2020 | $2,018 | $70,000 | $14,000 | $56,000 |
| 2019 | $2,756 | $70,000 | $14,000 | $56,000 |
| 2018 | $2,012 | $70,000 | $14,000 | $56,000 |
| 2017 | $2,007 | $70,000 | $14,000 | $56,000 |
| 2016 | $1,957 | $70,000 | $14,000 | $56,000 |
| 2015 | $1,983 | $71,600 | $14,300 | $57,300 |
| 2014 | -- | $71,600 | $14,300 | $57,300 |
Source: Public Records
Map
Nearby Homes
Your Personal Tour Guide
Ask me questions while you tour the home.