262 Apache St Westerville, OH 43081
Estimated Value: $414,000 - $471,164
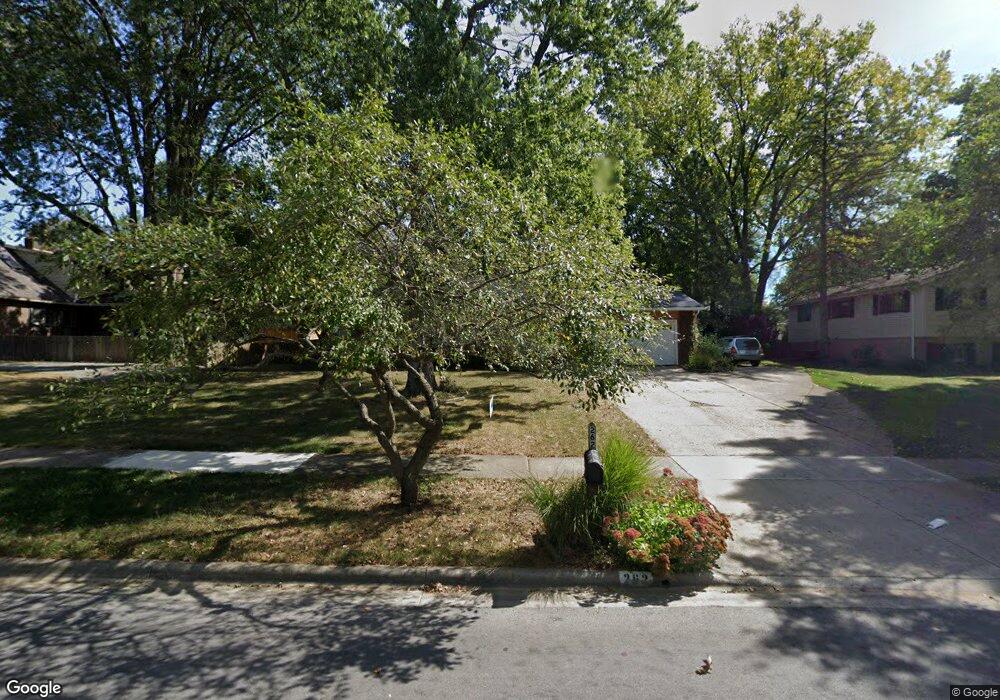
About This Home
This home is located at 262 Apache St, Westerville, OH 43081 and is currently estimated at $449,291, approximately $190 per square foot. 262 Apache St is a home located in Franklin County with nearby schools including Cherrington Elementary School, Blendon Middle School, and Westerville South High School.
Ownership History
We collect this data history from publicly available records. To have your information removed, we recommend requesting removal directly through your county’s website.
Purchase Details
Home Financials for this Owner
Home Financials are based on the most recent Mortgage that was taken out on this home.Purchase Details
Home Values in the Area
Average Home Value in this Area
Purchase History
We collect this data history from publicly available records. To have your information removed, we recommend requesting removal directly through your county’s website.
| Date | Buyer | Sale Price | Title Company |
|---|---|---|---|
| $166,200 | -- | ||
| $112,000 | -- |
Mortgage History
We collect this data history from publicly available records. To have your information removed, we recommend requesting removal directly through your county’s website.
| Date | Status | Borrower | Loan Amount |
|---|---|---|---|
| Open | $132,400 |
Tax History
We collect this data history from publicly available records. To have your information removed, we recommend requesting removal directly through your county’s website.
| Year | Tax Paid | Tax Assessment Tax Assessment Total Assessment is a certain percentage of the fair market value that is determined by local assessors to be the total taxable value of land and additions on the property. | Land | Improvement |
|---|---|---|---|---|
| 2025 | $7,718 | $135,810 | $35,950 | $99,860 |
| 2024 | $7,718 | $135,810 | $35,950 | $99,860 |
| 2023 | $7,555 | $135,800 | $35,945 | $99,855 |
| 2022 | $7,410 | $101,710 | $28,980 | $72,730 |
| 2021 | $7,472 | $101,710 | $28,980 | $72,730 |
| 2020 | $7,451 | $101,710 | $28,980 | $72,730 |
| 2019 | $6,252 | $80,570 | $28,980 | $51,590 |
| 2018 | $5,701 | $80,570 | $28,980 | $51,590 |
| 2017 | $6,149 | $80,570 | $28,980 | $51,590 |
| 2016 | $5,444 | $64,930 | $22,860 | $42,070 |
| 2015 | $5,272 | $64,930 | $22,860 | $42,070 |
| 2014 | $5,276 | $64,930 | $22,860 | $42,070 |
| 2013 | $2,635 | $64,925 | $22,855 | $42,070 |
Map
- 318 Apache Cir
- 192 Buckeye Ct
- 541 Cherrington Rd
- 441 S Spring Rd
- 793 Collingwood Dr
- 471 Woodview Rd
- 297 Electric Ave
- 44 N Spring Rd
- 730 Mohican Way
- 236 Drakewood Rd
- 80 Ash Ct
- 27 Nicole Dr
- 240 E Walnut St
- 588 Liberty Ln
- 344 Eastwood Ave
- 106 Nicole Dr
- 211 S Otterbein Ave
- 1127 E Walnut St
- 15 Kanpur Place
- 9 Kanpur Place
Ask me questions while you tour the home.