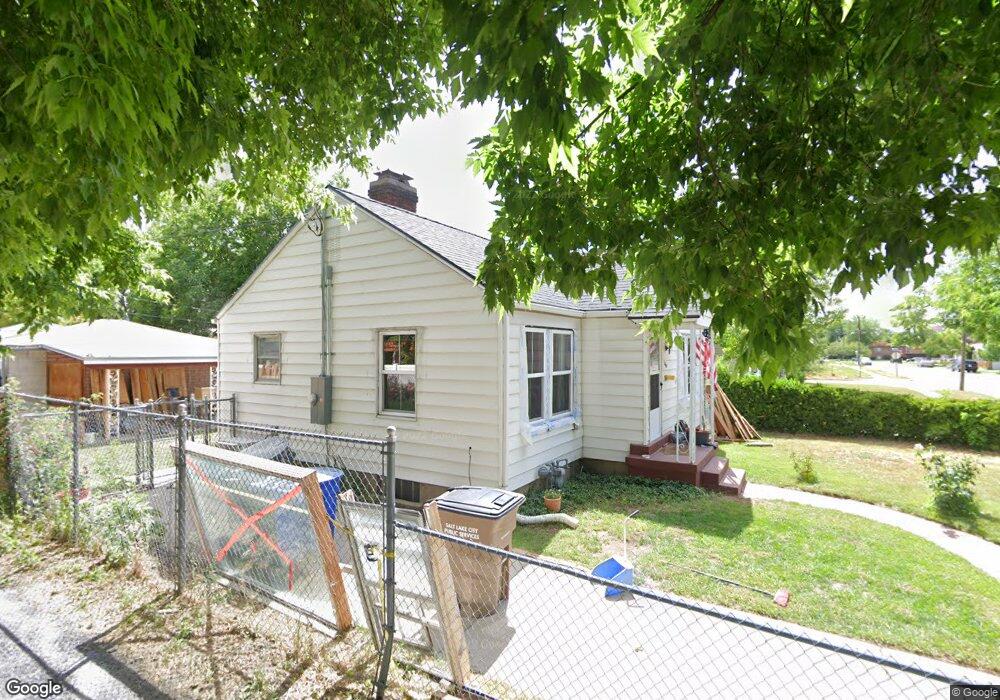
262 Browning Ave Salt Lake City, UT 84115
Liberty Wells NeighborhoodEstimated Value: $451,000 - $556,000
4
Beds
1
Bath
743
Sq Ft
$681/Sq Ft
Est. Value
About This Home
This home is located at 262 Browning Ave, Salt Lake City, UT 84115 and is currently estimated at $506,084, approximately $681 per square foot. 262 Browning Ave is a home located in Salt Lake County with nearby schools including Whittier Elementary School, Hillside Middle School, and Highland High School.
Ownership History
Date
Name
Owned For
Owner Type
Purchase Details
Closed on
Oct 4, 2021
Sold by
Prescott Nash Lloyd George
Bought by
Lloyd G Nash Revocable Trust
Current Estimated Value
Home Financials for this Owner
Home Financials are based on the most recent Mortgage that was taken out on this home.
Original Mortgage
$408,500
Outstanding Balance
$372,514
Interest Rate
2.8%
Mortgage Type
New Conventional
Estimated Equity
$133,570
Purchase Details
Closed on
Oct 1, 2021
Sold by
Nash Dairce and The Dairce Nash Revocable Trus
Bought by
Zieser Vincent F and Zieser Elie M
Home Financials for this Owner
Home Financials are based on the most recent Mortgage that was taken out on this home.
Original Mortgage
$408,500
Outstanding Balance
$372,514
Interest Rate
2.8%
Mortgage Type
New Conventional
Estimated Equity
$133,570
Purchase Details
Closed on
Sep 3, 1998
Sold by
Goaslind Jack H and Goaslind Gwen B
Bought by
Goaslind Jack H and Goaslind Gwen B
Purchase Details
Closed on
Aug 20, 1998
Sold by
Nash Lloyd G
Bought by
Nash Dairce and Nash Lloyd George
Create a Home Valuation Report for This Property
The Home Valuation Report is an in-depth analysis detailing your home's value as well as a comparison with similar homes in the area
Home Values in the Area
Average Home Value in this Area
Purchase History
| Date | Buyer | Sale Price | Title Company |
|---|---|---|---|
| Lloyd G Nash Revocable Trust | -- | -- | |
| Zieser Vincent F | -- | First American Title Ut Co | |
| Lloyd G Nash Revocable Trust | -- | -- | |
| Goaslind Jack H | -- | -- | |
| Nash Dairce | -- | -- |
Source: Public Records
Mortgage History
| Date | Status | Borrower | Loan Amount |
|---|---|---|---|
| Open | Zieser Vincent F | $408,500 |
Source: Public Records
Tax History Compared to Growth
Tax History
| Year | Tax Paid | Tax Assessment Tax Assessment Total Assessment is a certain percentage of the fair market value that is determined by local assessors to be the total taxable value of land and additions on the property. | Land | Improvement |
|---|---|---|---|---|
| 2025 | -- | $463,500 | $177,600 | $285,900 |
| 2024 | -- | $444,900 | $168,100 | $276,800 |
| 2023 | -- | $336,000 | $161,600 | $174,400 |
| 2022 | $0 | $340,100 | $158,400 | $181,700 |
| 2021 | $2,177 | $245,900 | $88,700 | $157,200 |
| 2020 | $1,464 | $217,700 | $80,800 | $136,900 |
| 2019 | $1,462 | $204,500 | $76,300 | $128,200 |
| 2018 | $1,362 | $185,600 | $76,300 | $109,300 |
| 2017 | $1,408 | $179,700 | $76,300 | $103,400 |
| 2016 | $1,335 | $161,800 | $64,200 | $97,600 |
| 2015 | $1,193 | $137,100 | $59,700 | $77,400 |
| 2014 | $1,209 | $137,800 | $61,600 | $76,200 |
Source: Public Records
Map
Nearby Homes
- 1401 S 300 E
- 1436 S Roberta St
- 1476 S 300 E
- 1332 S 200 E
- 217 E 1300 S
- 432 E Harrison Ave
- 419 E Sherman Ave
- 1240 S 400 E
- 1211 Liberty Wells Place
- 1470 S Edison St
- 359 Bryan Ave
- 1534 S 200 E
- 182 Edith Ave S
- 1175 S 300 E
- 182 E Kelsey Ave
- 1349 S 500 E
- 331 Hampton Ave S
- 438 Bryan Ave
- 1633 S 300 E
- 1617 S Major St
- 262 E Browning Ave
- 256 E Browning Ave
- 256 Browning Ave
- 268 E Browning Ave
- 268 Browning Ave
- 1415 S Roberta St
- 1415 S Roberta St
- 1427 Roberta St
- 1427 S Roberta St
- 1420 S 300 E
- 1410 S 300 E
- 1424 S 300 E
- 1437 Roberta St
- 265 E Browning Ave
- 265 E Browning Ave
- 265 Browning Ave
- 259 Browning Ave
- 271 E Browning Ave
- 271 Browning Ave
- 1432 S 300 E