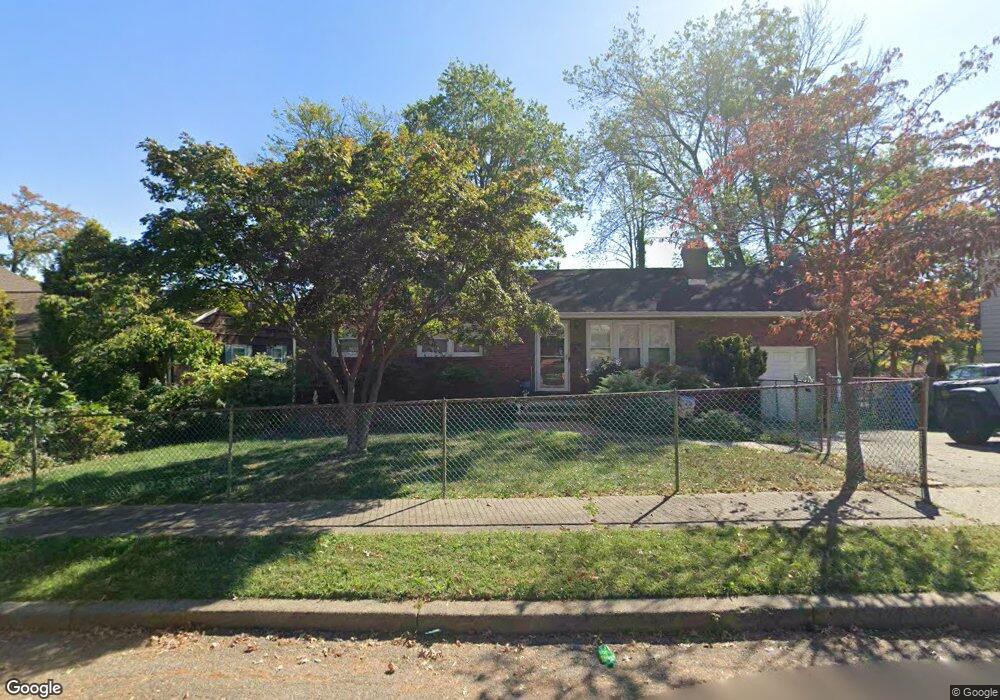
262 Dow Ave Iselin, NJ 08830
Estimated Value: $363,299 - $585,000
--
Bed
--
Bath
960
Sq Ft
$519/Sq Ft
Est. Value
About This Home
This home is located at 262 Dow Ave, Iselin, NJ 08830 and is currently estimated at $498,075, approximately $518 per square foot. 262 Dow Ave is a home located in Middlesex County with nearby schools including Kennedy Park School, Iselin Middle School, and John F. Kennedy Memorial High School.
Ownership History
Date
Name
Owned For
Owner Type
Purchase Details
Closed on
Jul 21, 2025
Sold by
Masters Maria and Brock Donna M
Bought by
Brock Gil B
Current Estimated Value
Home Financials for this Owner
Home Financials are based on the most recent Mortgage that was taken out on this home.
Original Mortgage
$303,310
Outstanding Balance
$302,792
Interest Rate
6.81%
Mortgage Type
New Conventional
Estimated Equity
$195,283
Purchase Details
Closed on
Apr 26, 1988
Bought by
Brock Donna C
Create a Home Valuation Report for This Property
The Home Valuation Report is an in-depth analysis detailing your home's value as well as a comparison with similar homes in the area
Home Values in the Area
Average Home Value in this Area
Purchase History
| Date | Buyer | Sale Price | Title Company |
|---|---|---|---|
| Brock Gil B | -- | None Listed On Document | |
| Brock Gil B | -- | None Listed On Document | |
| Brock Donna C | -- | -- |
Source: Public Records
Mortgage History
| Date | Status | Borrower | Loan Amount |
|---|---|---|---|
| Open | Brock Gil B | $303,310 | |
| Closed | Brock Gil B | $303,310 |
Source: Public Records
Tax History Compared to Growth
Tax History
| Year | Tax Paid | Tax Assessment Tax Assessment Total Assessment is a certain percentage of the fair market value that is determined by local assessors to be the total taxable value of land and additions on the property. | Land | Improvement |
|---|---|---|---|---|
| 2025 | $8,612 | $71,300 | $21,200 | $50,100 |
| 2024 | $8,428 | $71,300 | $21,200 | $50,100 |
| 2023 | $8,428 | $71,300 | $21,200 | $50,100 |
| 2022 | $8,221 | $71,300 | $21,200 | $50,100 |
| 2021 | $7,590 | $71,300 | $21,200 | $50,100 |
| 2020 | $7,896 | $71,300 | $21,200 | $50,100 |
| 2019 | $7,702 | $71,300 | $21,200 | $50,100 |
| 2018 | $7,551 | $71,300 | $21,200 | $50,100 |
| 2017 | $7,416 | $71,300 | $21,200 | $50,100 |
| 2016 | $7,355 | $71,300 | $21,200 | $50,100 |
| 2015 | $7,230 | $71,300 | $21,200 | $50,100 |
| 2014 | $7,074 | $71,300 | $21,200 | $50,100 |
Source: Public Records
Map
Nearby Homes
- 27 Eagle St
- 82 Ravine Dr
- 319 Benjamin Ave
- 19 Claudia St
- 399 Middlesex Ave
- 15 Grand Ave
- 147 Warwick St
- 220 Elizabeth Ave
- 68 Grand Ave
- 148 Elizabeth Ave
- 188 Bloomfield Ave
- 16 Stafford Rd
- 170 Benjamin Ave
- 990 Rebecca Place
- 105 Grand Ave
- 403 New Dover Rd
- 109 S Harrison Ave
- 42 Harrow Dr
- 137 Cooper Ave
- 145 Creemer Ave