Estimated Value: $607,000 - $658,000
5
Beds
3
Baths
3,000
Sq Ft
$211/Sq Ft
Est. Value
About This Home
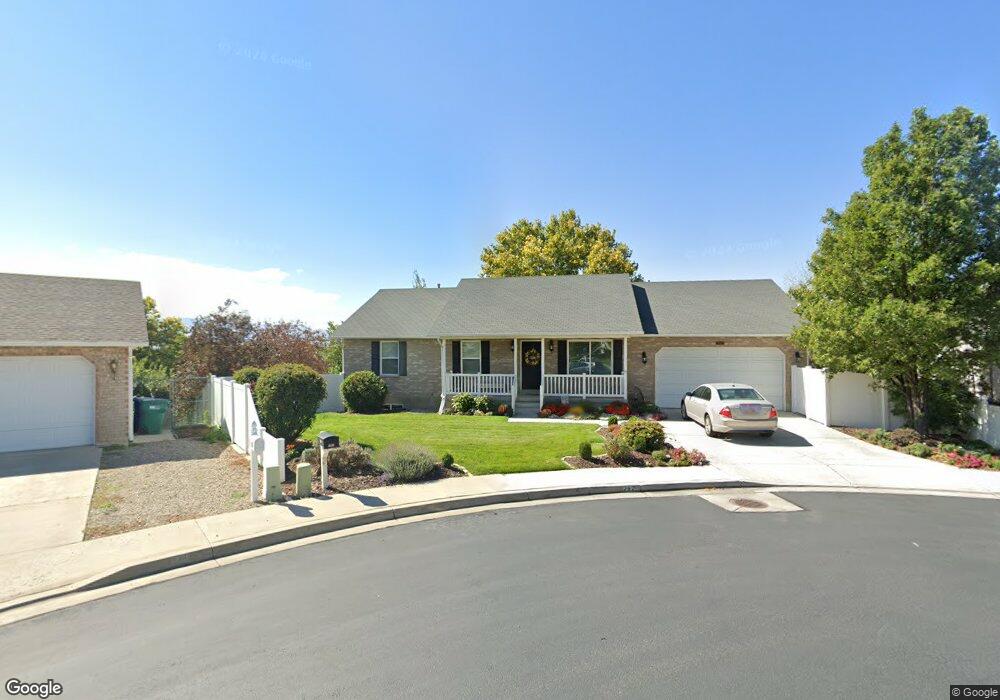
This home is located at 262 E 1700 N, Lehi, UT 84043 and is currently estimated at $633,911, approximately $211 per square foot. 262 E 1700 N is a home located in Utah County with nearby schools including Sego Lily Elementary School, Lehi Junior High School, and Skyridge High School.
Ownership History
Date
Name
Owned For
Owner Type
Purchase Details
Closed on
May 1, 2023
Sold by
Cragun Brian
Bought by
Leanne Cragun Revocable Trust
Current Estimated Value
Purchase Details
Closed on
Oct 1, 2018
Sold by
Olsen Larry D
Bought by
Cragun Brian and Cragun Leanne
Home Financials for this Owner
Home Financials are based on the most recent Mortgage that was taken out on this home.
Original Mortgage
$351,500
Interest Rate
4.5%
Mortgage Type
New Conventional
Purchase Details
Closed on
Aug 1, 2007
Sold by
Olsen Larry D and Olsen Patricia K
Bought by
Olsen Larry D
Home Financials for this Owner
Home Financials are based on the most recent Mortgage that was taken out on this home.
Original Mortgage
$250,000
Interest Rate
6.66%
Mortgage Type
New Conventional
Create a Home Valuation Report for This Property
The Home Valuation Report is an in-depth analysis detailing your home's value as well as a comparison with similar homes in the area
Home Values in the Area
Average Home Value in this Area
Purchase History
We collect this data history from publicly available records. To have your information removed, we recommend requesting removal directly through your county’s website.
| Date | Buyer | Sale Price | Title Company |
|---|---|---|---|
| Leanne Cragun Revocable Trust | -- | None Listed On Document | |
| Cragun Brian | -- | Vanguard Title Ins Agency Ll | |
| Olsen Larry D | -- | Vanguard Title Ins Agency Ll | |
| Olsen Larry D | -- | Equity Title Production F |
Source: Public Records
Mortgage History
We collect this data history from publicly available records. To have your information removed, we recommend requesting removal directly through your county’s website.
| Date | Status | Borrower | Loan Amount |
|---|---|---|---|
| Previous Owner | Cragun Brian | $351,500 | |
| Previous Owner | Olsen Larry D | $250,000 |
Source: Public Records
Tax History
| Year | Tax Paid | Tax Assessment Tax Assessment Total Assessment is a certain percentage of the fair market value that is determined by local assessors to be the total taxable value of land and additions on the property. | Land | Improvement |
|---|---|---|---|---|
| 2025 | $2,393 | $308,715 | -- | -- |
| 2024 | $2,393 | $280,005 | $0 | $0 |
| 2023 | $2,242 | $284,900 | $0 | $0 |
| 2022 | $2,362 | $291,005 | $0 | $0 |
| 2021 | $2,117 | $394,300 | $121,300 | $273,000 |
| 2020 | $1,996 | $367,400 | $112,300 | $255,100 |
| 2019 | $1,838 | $351,800 | $112,300 | $239,500 |
| 2018 | $1,730 | $312,900 | $100,700 | $212,200 |
| 2017 | $1,543 | $148,390 | $0 | $0 |
| 2016 | $1,520 | $135,630 | $0 | $0 |
| 2015 | $1,708 | $144,705 | $0 | $0 |
| 2014 | $1,605 | $135,135 | $0 | $0 |
Source: Public Records
Map
Nearby Homes
- 1732 N 180 E
- 1716 N 180 E
- 261 E 1700 N
- 261 E 1700 N Unit 206
- 251 Hansen Ridge Dr
- 251 Hansen Ridge
- 1739 N 180 E
- 225 E Hansen Ridge
- 1684 N 180 E
- 275 E 1700 N
- 1717 N 180 E
- 1717 N 180 E Unit 24
- 1775 N 180 E
- 275 Hansen Ridge Dr
- 181 E Hansen Ridge
- 275 E Hansen Ridge
- 275 Hansen Ridge
- 181 E Hansen Ridge
- 1683 N 180 E
- 1662 N 180 E
Your Personal Tour Guide
Ask me questions while you tour the home.