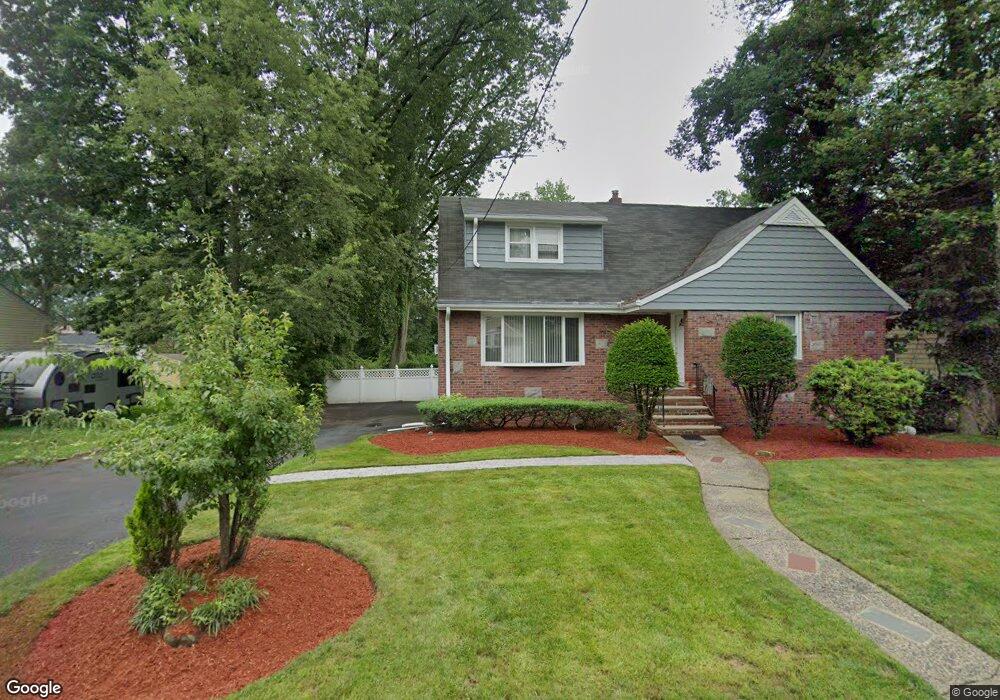
262 E Tryon Ave Teaneck, NJ 07666
Estimated Value: $571,000 - $641,000
3
Beds
2
Baths
1,617
Sq Ft
$376/Sq Ft
Est. Value
About This Home
This home is located at 262 E Tryon Ave, Teaneck, NJ 07666 and is currently estimated at $607,846, approximately $375 per square foot. 262 E Tryon Ave is a home located in Bergen County with nearby schools including Teaneck Senior High School, Wilbert F Mays Seventh-Day Adventist School, and Ability School.
Ownership History
Date
Name
Owned For
Owner Type
Purchase Details
Closed on
Oct 11, 2016
Sold by
Chambers Nugent A and Chambers Nugent A
Bought by
Chin Jason R and Chin Rene
Current Estimated Value
Purchase Details
Closed on
Apr 27, 2012
Sold by
Chambers Doris and Clarke-Allen Doris
Bought by
Chambers Doris
Home Financials for this Owner
Home Financials are based on the most recent Mortgage that was taken out on this home.
Original Mortgage
$82,508
Interest Rate
4%
Mortgage Type
New Conventional
Purchase Details
Closed on
May 16, 2003
Sold by
Brown Vevolin
Bought by
Clarke Doris
Home Financials for this Owner
Home Financials are based on the most recent Mortgage that was taken out on this home.
Original Mortgage
$160,000
Interest Rate
5.77%
Create a Home Valuation Report for This Property
The Home Valuation Report is an in-depth analysis detailing your home's value as well as a comparison with similar homes in the area
Home Values in the Area
Average Home Value in this Area
Purchase History
| Date | Buyer | Sale Price | Title Company |
|---|---|---|---|
| Chin Jason R | $330,000 | Title Insurance Commitment | |
| Chambers Doris | -- | -- | |
| Clarke Doris | $74,750 | -- |
Source: Public Records
Mortgage History
| Date | Status | Borrower | Loan Amount |
|---|---|---|---|
| Previous Owner | Chambers Doris | $82,508 | |
| Previous Owner | Clarke Doris | $160,000 |
Source: Public Records
Tax History
| Year | Tax Paid | Tax Assessment Tax Assessment Total Assessment is a certain percentage of the fair market value that is determined by local assessors to be the total taxable value of land and additions on the property. | Land | Improvement |
|---|---|---|---|---|
| 2025 | $10,752 | $492,300 | $236,200 | $256,100 |
| 2024 | $10,533 | $492,300 | $236,200 | $256,100 |
| 2023 | $10,326 | $319,000 | $148,300 | $170,700 |
| 2022 | $10,326 | $319,000 | $148,300 | $170,700 |
| 2021 | $10,387 | $319,000 | $148,300 | $170,700 |
| 2020 | $10,316 | $319,000 | $148,300 | $170,700 |
| 2019 | $10,198 | $319,000 | $148,300 | $170,700 |
| 2018 | $10,122 | $319,000 | $148,300 | $170,700 |
| 2017 | $9,545 | $303,700 | $148,300 | $155,400 |
| 2016 | $9,403 | $303,700 | $148,300 | $155,400 |
| 2015 | $9,254 | $303,700 | $148,300 | $155,400 |
| 2014 | $10,883 | $423,300 | $232,600 | $190,700 |
Source: Public Records
Map
Nearby Homes
- 40 Oakland St
- 384 W Palisade Ave
- 56 Herzog Place
- 60 Herzog Place
- 208 Manhattan Ave
- 174 Manhattan Ave
- 260 Hamilton Rd
- 266 Hamilton Rd
- 152 Washington Place
- 320 W Palisade Ave
- 130 Glenbrook Pkwy Unit 5E
- 285 W Palisade Ave
- 285 - 287 W Palisades
- 291 Liberty Rd
- 250 Stuyvesant Rd
- 137 Voorhees St
- 403 Lantana Ave
- 1485 Gaylord Terrace
- 55 Hamilton Rd
- 1806 Rensselaer Rd
- 434 Tryon Ave
- 250 E Tryon Ave
- 1615 Ardsley Ct
- 430 Tryon Ave
- 1609 Ardsley Ct
- 44 Belmont St
- 242 E Tryon Ave
- 46 Belmont St
- 426 Tryon Ave
- 40 Belmont St
- 1632 Fairfield St
- 36 Belmont St
- 1631 Ardsley Ct
- 54 Belmont St
- 431 Tryon Ave
- 1636 Fairfield St
- 1637 Ardsley Ct
- 30 Belmont St
- 427 Tryon Ave
- 1642 Fairfield St
Your Personal Tour Guide
Ask me questions while you tour the home.