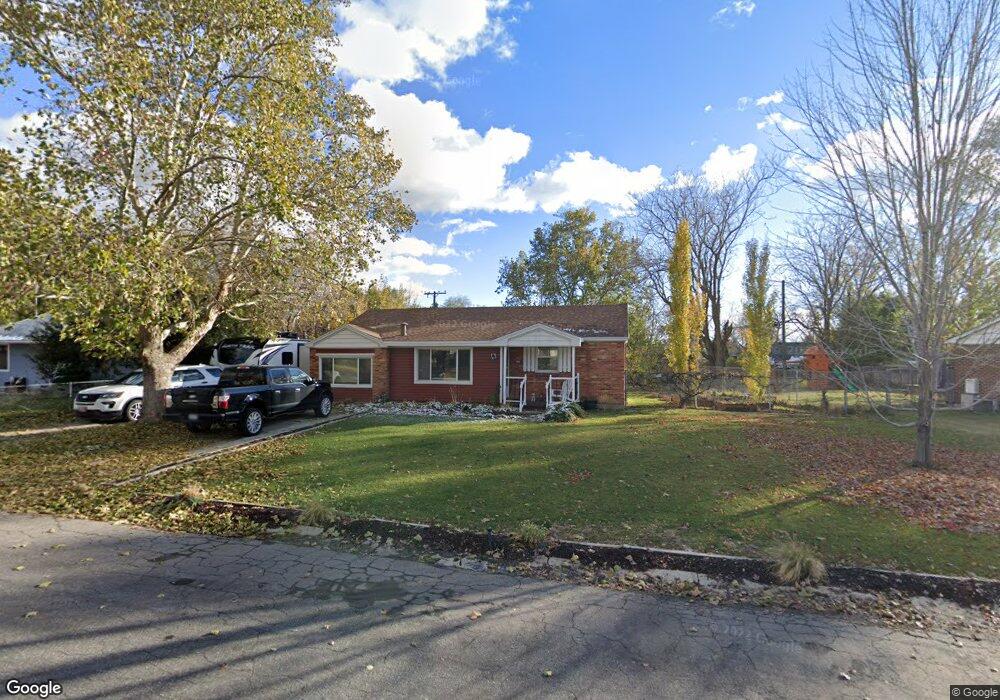
262 Glen Place Layton, UT 84041
Estimated Value: $362,000 - $418,000
1
Bed
2
Baths
1,555
Sq Ft
$248/Sq Ft
Est. Value
About This Home
This home is located at 262 Glen Place, Layton, UT 84041 and is currently estimated at $384,924, approximately $247 per square foot. 262 Glen Place is a home located in Davis County with nearby schools including Crestview Elementary School, Central Davis Junior High School, and Layton High School.
Ownership History
Date
Name
Owned For
Owner Type
Purchase Details
Closed on
Apr 4, 2024
Sold by
Case Craig D
Bought by
Craig Donald Case And Marsha Case Family Trus and Case
Current Estimated Value
Purchase Details
Closed on
Jul 25, 2012
Sold by
Case Craig D and Case Marsha N
Bought by
Case Marsha N and Case Craig D
Home Financials for this Owner
Home Financials are based on the most recent Mortgage that was taken out on this home.
Original Mortgage
$109,000
Interest Rate
3.65%
Mortgage Type
New Conventional
Purchase Details
Closed on
Apr 27, 2007
Sold by
Coburn Thomas Ellinger
Bought by
Case Craig D and Case Marsha N
Home Financials for this Owner
Home Financials are based on the most recent Mortgage that was taken out on this home.
Original Mortgage
$112,500
Interest Rate
6.11%
Mortgage Type
Purchase Money Mortgage
Create a Home Valuation Report for This Property
The Home Valuation Report is an in-depth analysis detailing your home's value as well as a comparison with similar homes in the area
Home Values in the Area
Average Home Value in this Area
Purchase History
| Date | Buyer | Sale Price | Title Company |
|---|---|---|---|
| Craig Donald Case And Marsha Case Family Trus | -- | None Listed On Document | |
| Case Marsha N | -- | Bonneville Superior | |
| Case Craig D | -- | Heritage West Title Ins Agen |
Source: Public Records
Mortgage History
| Date | Status | Borrower | Loan Amount |
|---|---|---|---|
| Previous Owner | Case Marsha N | $109,000 | |
| Previous Owner | Case Craig D | $112,500 |
Source: Public Records
Tax History Compared to Growth
Tax History
| Year | Tax Paid | Tax Assessment Tax Assessment Total Assessment is a certain percentage of the fair market value that is determined by local assessors to be the total taxable value of land and additions on the property. | Land | Improvement |
|---|---|---|---|---|
| 2025 | $1,703 | $178,750 | $110,823 | $67,927 |
| 2024 | $1,638 | $173,250 | $128,581 | $44,669 |
| 2023 | $1,540 | $287,000 | $147,857 | $139,143 |
| 2022 | $1,592 | $161,150 | $79,658 | $81,492 |
| 2021 | $1,597 | $241,000 | $115,768 | $125,232 |
| 2020 | $1,464 | $212,000 | $95,699 | $116,301 |
| 2019 | $1,382 | $196,000 | $89,361 | $106,639 |
| 2018 | $1,278 | $182,000 | $89,361 | $92,639 |
| 2016 | $1,000 | $73,425 | $29,649 | $43,776 |
| 2015 | $946 | $65,945 | $29,649 | $36,296 |
| 2014 | $910 | $64,883 | $29,649 | $35,234 |
| 2013 | -- | $70,724 | $16,544 | $54,180 |
Source: Public Records
Map
Nearby Homes