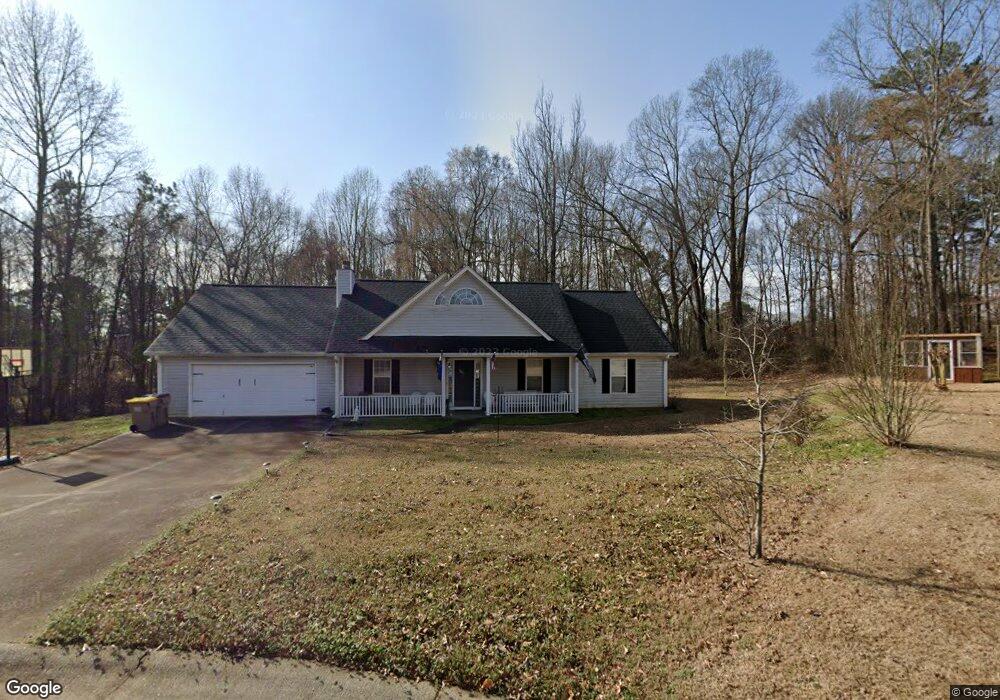
262 Hawthorne Dr Jefferson, GA 30549
Estimated Value: $331,000 - $353,000
3
Beds
2
Baths
1,408
Sq Ft
$240/Sq Ft
Est. Value
About This Home
This home is located at 262 Hawthorne Dr, Jefferson, GA 30549 and is currently estimated at $337,954, approximately $240 per square foot. 262 Hawthorne Dr is a home located in Jackson County with nearby schools including Gum Springs Elementary School, West Jackson Middle School, and Jackson County High School.
Ownership History
Date
Name
Owned For
Owner Type
Purchase Details
Closed on
Jan 28, 2019
Sold by
Layson Charlie
Bought by
Layson Charlie and Peavey Barbara
Current Estimated Value
Purchase Details
Closed on
Oct 15, 2018
Sold by
Bnr Holdings Llc
Bought by
Snyder James
Home Financials for this Owner
Home Financials are based on the most recent Mortgage that was taken out on this home.
Original Mortgage
$171,612
Interest Rate
4.6%
Purchase Details
Closed on
Apr 22, 2014
Sold by
Jones C Bruce
Bought by
Bnr Holdings Llc
Purchase Details
Closed on
Nov 9, 2007
Sold by
Not Provided
Bought by
Jones C B
Home Financials for this Owner
Home Financials are based on the most recent Mortgage that was taken out on this home.
Original Mortgage
$114,000
Interest Rate
6.32%
Mortgage Type
New Conventional
Purchase Details
Closed on
May 18, 2001
Sold by
Millstone Communitie
Bought by
Maddox Sharon B
Purchase Details
Closed on
Jan 23, 2001
Sold by
Wishbone Partners
Bought by
Millstone Communitie
Create a Home Valuation Report for This Property
The Home Valuation Report is an in-depth analysis detailing your home's value as well as a comparison with similar homes in the area
Home Values in the Area
Average Home Value in this Area
Purchase History
| Date | Buyer | Sale Price | Title Company |
|---|---|---|---|
| Layson Charlie | -- | -- | |
| Snyder James | $168,000 | -- | |
| Bnr Holdings Llc | -- | -- | |
| Jones C B | $120,000 | -- | |
| Maddox Sharon B | $113,900 | -- | |
| Millstone Communitie | $22,000 | -- |
Source: Public Records
Mortgage History
| Date | Status | Borrower | Loan Amount |
|---|---|---|---|
| Previous Owner | Snyder James | $171,612 | |
| Previous Owner | Jones C B | $114,000 |
Source: Public Records
Tax History Compared to Growth
Tax History
| Year | Tax Paid | Tax Assessment Tax Assessment Total Assessment is a certain percentage of the fair market value that is determined by local assessors to be the total taxable value of land and additions on the property. | Land | Improvement |
|---|---|---|---|---|
| 2024 | $709 | $90,240 | $24,000 | $66,240 |
| 2023 | $1,464 | $79,160 | $24,000 | $55,160 |
| 2022 | $1,141 | $72,040 | $24,000 | $48,040 |
| 2021 | $825 | $60,840 | $12,800 | $48,040 |
| 2020 | $640 | $52,920 | $12,800 | $40,120 |
| 2019 | $1,721 | $52,920 | $12,800 | $40,120 |
| 2018 | $1,678 | $50,960 | $12,800 | $38,160 |
| 2017 | $1,665 | $50,166 | $12,800 | $37,366 |
| 2016 | $1,591 | $47,668 | $12,000 | $35,668 |
| 2015 | $1,466 | $43,970 | $10,000 | $33,970 |
| 2014 | $1,099 | $32,908 | $10,000 | $22,908 |
| 2013 | -- | $32,908 | $10,000 | $22,908 |
Source: Public Records
Map
Nearby Homes
- 248 Hawthorne Dr
- 261 Hawthorne Dr
- 247 Hawthorne Dr
- 220 Hawthorne Dr
- 1500 Jackson Trail Rd
- 4054 Winder Hwy
- 223 Hawthorne Dr
- 1540 Jackson Trail Rd
- 4002 Winder Hwy
- 4060 Winder Hwy
- 186 Hawthorne Dr
- 191 Hawthorne Dr
- 1570 Jackson Trail Rd
- 160 Hawthorne Dr
- 1513 Jackson Trail Rd
- 167 Hawthorne Dr
- 4077 Winder Hwy
- 0 Hawthorne Dr Unit 8825219
- 1295 Jackson Trail Rd
- 3920 Winder Hwy