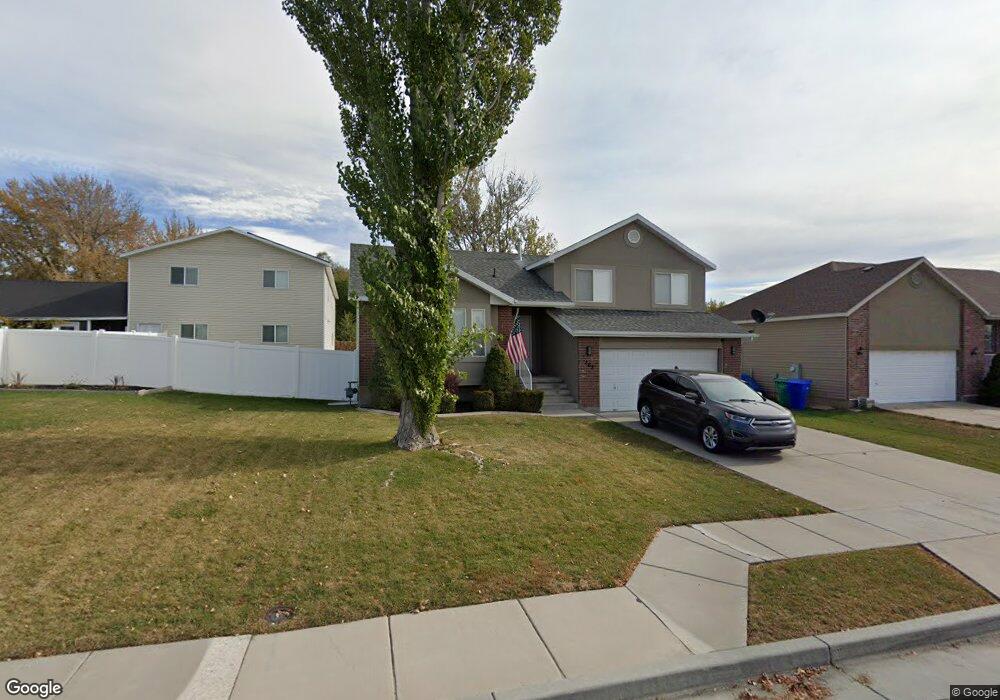
262 N 1660 W Clearfield, UT 84015
Estimated Value: $476,000 - $494,883
3
Beds
2
Baths
2,154
Sq Ft
$224/Sq Ft
Est. Value
About This Home
This home is located at 262 N 1660 W, Clearfield, UT 84015 and is currently estimated at $481,721, approximately $223 per square foot. 262 N 1660 W is a home located in Davis County with nearby schools including Lakeside School, West Point Junior High School, and Syracuse High School.
Ownership History
Date
Name
Owned For
Owner Type
Purchase Details
Closed on
Sep 29, 2020
Sold by
Hughes Joshua E
Bought by
Walker Brandon
Current Estimated Value
Purchase Details
Closed on
Nov 25, 2013
Sold by
Frealy Todd A
Bought by
Hughes Joshua E
Home Financials for this Owner
Home Financials are based on the most recent Mortgage that was taken out on this home.
Original Mortgage
$101,500
Interest Rate
4.08%
Mortgage Type
New Conventional
Purchase Details
Closed on
Jun 8, 2006
Sold by
Vankomen Robert H
Bought by
Mcfarland Randy K G
Purchase Details
Closed on
Dec 28, 2004
Sold by
Vankomen Janie B
Bought by
Vankomen Robert H and R H Vankomen & Co
Home Financials for this Owner
Home Financials are based on the most recent Mortgage that was taken out on this home.
Original Mortgage
$143,600
Interest Rate
5.8%
Mortgage Type
Purchase Money Mortgage
Create a Home Valuation Report for This Property
The Home Valuation Report is an in-depth analysis detailing your home's value as well as a comparison with similar homes in the area
Home Values in the Area
Average Home Value in this Area
Purchase History
| Date | Buyer | Sale Price | Title Company |
|---|---|---|---|
| Walker Brandon | -- | Mountain View T&E | |
| Hughes Joshua E | -- | Fidelity National Title | |
| Mcfarland Randy K G | -- | Bonneville Superior Title Co | |
| Vankomen Robert H | -- | Bonneville Title Company |
Source: Public Records
Mortgage History
| Date | Status | Borrower | Loan Amount |
|---|---|---|---|
| Previous Owner | Hughes Joshua E | $101,500 | |
| Previous Owner | Vankomen Robert H | $143,600 |
Source: Public Records
Tax History Compared to Growth
Tax History
| Year | Tax Paid | Tax Assessment Tax Assessment Total Assessment is a certain percentage of the fair market value that is determined by local assessors to be the total taxable value of land and additions on the property. | Land | Improvement |
|---|---|---|---|---|
| 2025 | $2,500 | $234,300 | $105,148 | $129,152 |
| 2024 | $2,571 | $242,000 | $94,702 | $147,298 |
| 2023 | $2,356 | $408,000 | $115,742 | $292,258 |
| 2022 | $2,530 | $239,800 | $59,572 | $180,228 |
| 2021 | $2,271 | $322,000 | $95,551 | $226,449 |
| 2020 | $1,980 | $277,000 | $79,816 | $197,184 |
| 2019 | $1,848 | $255,000 | $77,572 | $177,428 |
| 2018 | $1,647 | $224,000 | $78,580 | $145,420 |
| 2016 | $1,318 | $94,325 | $30,360 | $63,965 |
| 2015 | $1,132 | $76,010 | $30,360 | $45,650 |
| 2014 | $1,322 | $90,929 | $30,360 | $60,569 |
| 2013 | -- | $93,125 | $27,918 | $65,207 |
Source: Public Records
Map
Nearby Homes
- 1774 W 400 N
- 47 N 1750 W
- 1652 W 560 N
- 575 N 1350 W Unit 137
- 1350 W 300 N Unit 49
- 1350 W 300 N Unit 38
- 1350 W 300 N Unit 29
- 563 N 1350 W Unit 139
- 1828 W 75 S
- 1337 W 550 N Unit 195
- 1648 W 150 S
- 135 S 1525 W
- 1805 W 675 N
- 12 N 2000 W Unit 1
- 16 N 1300 W
- 423 N 1250 W Unit 118
- 607 N 2000 W
- 303 N Canterbury Way
- 1832 W 725 N
- 417 N 1200 W Unit 84