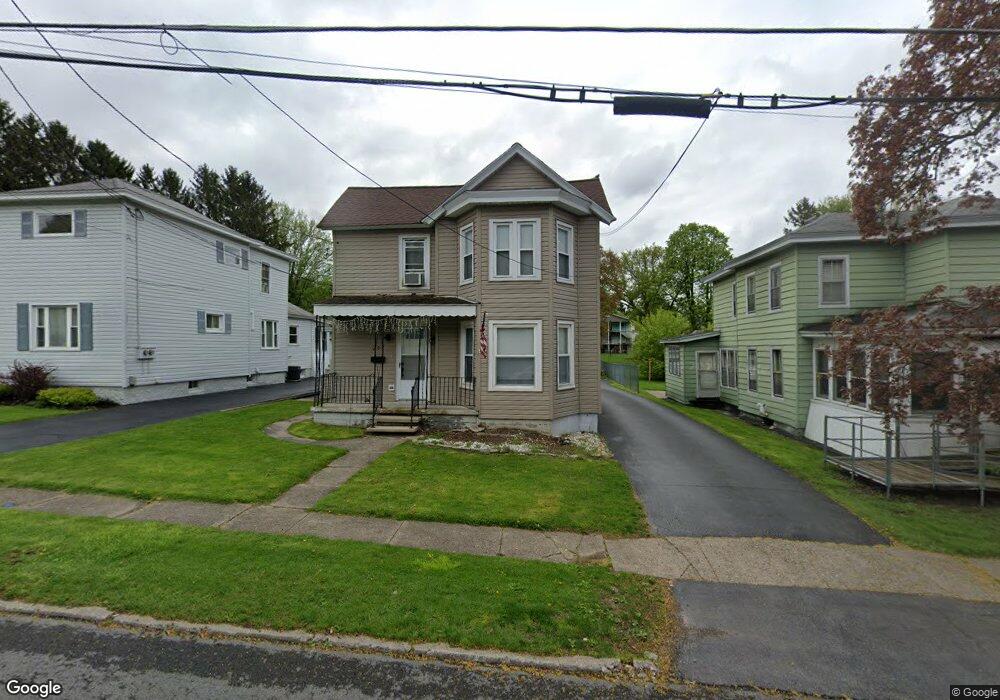
262 Seymour St Unit 264 Auburn, NY 13021
Estimated Value: $134,000 - $164,173
5
Beds
2
Baths
2,422
Sq Ft
$61/Sq Ft
Est. Value
About This Home
This home is located at 262 Seymour St Unit 264, Auburn, NY 13021 and is currently estimated at $146,543, approximately $60 per square foot. 262 Seymour St Unit 264 is a home located in Cayuga County with nearby schools including Auburn Junior High School, Auburn High School, and Creative Minds Montessori School.
Ownership History
Date
Name
Owned For
Owner Type
Purchase Details
Closed on
Aug 11, 2021
Sold by
Casler Paul J
Bought by
Huttar Zackery T
Current Estimated Value
Home Financials for this Owner
Home Financials are based on the most recent Mortgage that was taken out on this home.
Original Mortgage
$97,485
Outstanding Balance
$88,644
Interest Rate
2.9%
Mortgage Type
Purchase Money Mortgage
Estimated Equity
$57,899
Purchase Details
Closed on
Jun 10, 2009
Sold by
Graceffo Carmella
Bought by
Casler Paul
Home Financials for this Owner
Home Financials are based on the most recent Mortgage that was taken out on this home.
Original Mortgage
$59,015
Interest Rate
4.82%
Mortgage Type
FHA
Purchase Details
Closed on
Jun 2, 2009
Sold by
Welch Shirley and Calderaro Ann Marie
Bought by
Casler Paul J
Home Financials for this Owner
Home Financials are based on the most recent Mortgage that was taken out on this home.
Original Mortgage
$59,015
Interest Rate
4.82%
Mortgage Type
FHA
Create a Home Valuation Report for This Property
The Home Valuation Report is an in-depth analysis detailing your home's value as well as a comparison with similar homes in the area
Home Values in the Area
Average Home Value in this Area
Purchase History
| Date | Buyer | Sale Price | Title Company |
|---|---|---|---|
| Huttar Zackery T | $100,500 | None Available | |
| Casler Paul | $63,000 | Riccardo Galbato | |
| Casler Paul J | $63,000 | None Available |
Source: Public Records
Mortgage History
| Date | Status | Borrower | Loan Amount |
|---|---|---|---|
| Open | Huttar Zackery T | $97,485 | |
| Previous Owner | Casler Paul J | $59,015 |
Source: Public Records
Tax History Compared to Growth
Tax History
| Year | Tax Paid | Tax Assessment Tax Assessment Total Assessment is a certain percentage of the fair market value that is determined by local assessors to be the total taxable value of land and additions on the property. | Land | Improvement |
|---|---|---|---|---|
| 2024 | $2,238 | $96,000 | $14,900 | $81,100 |
| 2023 | $2,236 | $96,000 | $14,900 | $81,100 |
| 2022 | $2,342 | $96,000 | $14,900 | $81,100 |
| 2021 | $2,329 | $85,000 | $14,000 | $71,000 |
| 2020 | $2,300 | $85,000 | $14,000 | $71,000 |
| 2019 | $723 | $85,000 | $14,000 | $71,000 |
| 2018 | $2,226 | $85,000 | $14,000 | $71,000 |
| 2017 | $2,184 | $79,800 | $14,300 | $65,500 |
| 2016 | $2,679 | $79,800 | $14,300 | $65,500 |
| 2015 | $861 | $79,800 | $14,300 | $65,500 |
| 2014 | $861 | $79,800 | $14,300 | $65,500 |
Source: Public Records
Map
Nearby Homes
- 183 van Anden St
- 68 N Division St
- 50 N Division St
- 189 Cottage St
- 99 Washington St
- 107-109 Wall St
- 88 N Division St
- 90 N Division St
- 122 Cottage St
- 8 Spring St
- 8/151/9-11 Spring State Aurelius St
- 21-23 Derby Ave
- 206-210 Seymour St
- 53 West St
- 47 West St Unit 49
- 7 Barber St
- 120 Cottage St Unit A
- 120 Cottage St Unit B
- 63 Washington St
- 5 West St
- 260 Seymour St
- 268 Seymour St
- 258 Seymour St
- 270 Seymour St
- 256 Seymour St
- 272 Seymour St
- 254 Seymour St
- 261 Seymour St Unit 263
- 169 van Anden St
- 167 van Anden St
- 274 Seymour St
- 171 van Anden St
- 165 van Anden St
- 259 Seymour St
- 267 Seymour St Unit 269
- 250 Seymour St Unit 252
- 265 Seymour St
- 271 Seymour St
- 163 van Anden St
- 276 Seymour St