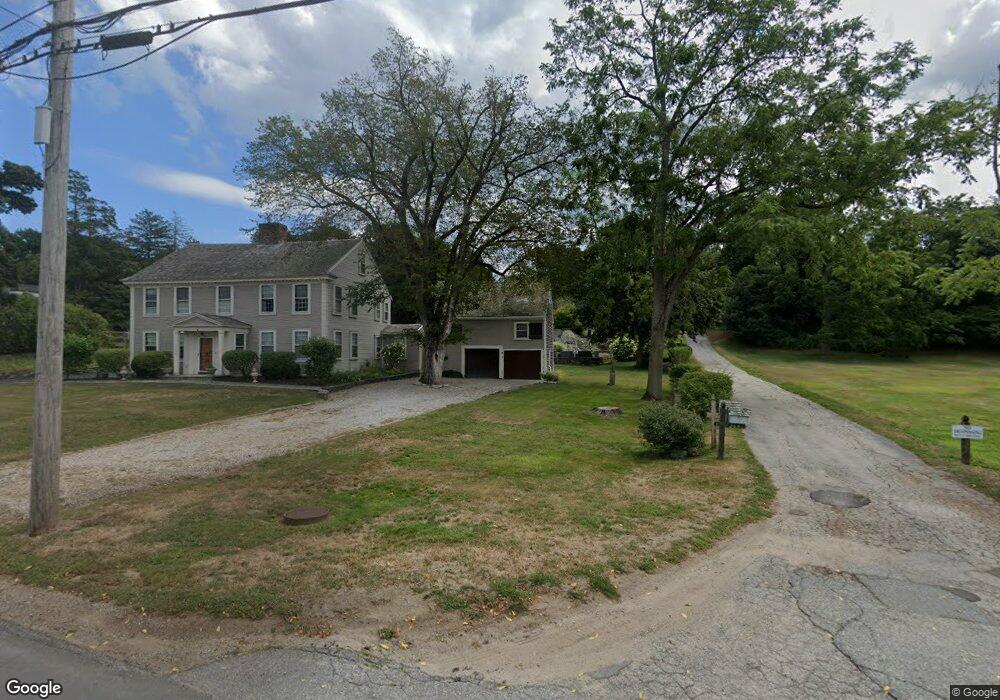
262 South St Hingham, MA 02043
Estimated Value: $1,604,071 - $2,215,000
5
Beds
4
Baths
3,747
Sq Ft
$492/Sq Ft
Est. Value
About This Home
This home is located at 262 South St, Hingham, MA 02043 and is currently estimated at $1,842,690, approximately $491 per square foot. 262 South St is a home located in Plymouth County with nearby schools including Plymouth River Elementary School, Hingham Middle School, and Hingham High School.
Ownership History
Date
Name
Owned For
Owner Type
Purchase Details
Closed on
May 25, 2016
Sold by
Born Jeffery A and Born Mary A
Bought by
Born Ft
Current Estimated Value
Purchase Details
Closed on
May 24, 2016
Sold by
Born Jeffery A and Born Mary A
Bought by
Born Ft
Purchase Details
Closed on
Oct 29, 2014
Sold by
Underwood Greer M
Bought by
Born Jeffrey A and Born Mary A
Purchase Details
Closed on
Sep 11, 1991
Sold by
Darsulin Rt
Bought by
Born Jeffery A and Born Mary A
Purchase Details
Closed on
Jun 16, 1988
Sold by
C M R Rt
Bought by
Darsulin Rt
Create a Home Valuation Report for This Property
The Home Valuation Report is an in-depth analysis detailing your home's value as well as a comparison with similar homes in the area
Purchase History
| Date | Buyer | Sale Price | Title Company |
|---|---|---|---|
| Born Ft | -- | -- | |
| Born Ft | -- | -- | |
| Born Jeffrey A | $16,000 | -- | |
| Born Jeffery A | $305,000 | -- | |
| Born Jeffery A | $305,000 | -- | |
| Darsulin Rt | $245,000 | -- |
Source: Public Records
Mortgage History
| Date | Status | Borrower | Loan Amount |
|---|---|---|---|
| Previous Owner | Darsulin Rt | $600,000 | |
| Previous Owner | Darsulin Rt | $322,000 |
Source: Public Records
Tax History Compared to Growth
Tax History
| Year | Tax Paid | Tax Assessment Tax Assessment Total Assessment is a certain percentage of the fair market value that is determined by local assessors to be the total taxable value of land and additions on the property. | Land | Improvement |
|---|---|---|---|---|
| 2025 | $13,830 | $1,293,700 | $489,300 | $804,400 |
| 2024 | $13,213 | $1,217,800 | $489,300 | $728,500 |
| 2023 | $11,531 | $1,153,100 | $489,300 | $663,800 |
| 2022 | $10,496 | $908,000 | $377,600 | $530,400 |
| 2021 | $10,175 | $862,300 | $377,600 | $484,700 |
| 2020 | $9,942 | $862,300 | $377,600 | $484,700 |
| 2019 | $9,825 | $831,900 | $377,600 | $454,300 |
| 2018 | $25,095 | $831,900 | $377,600 | $454,300 |
| 2017 | $9,357 | $763,800 | $386,200 | $377,600 |
| 2016 | $9,460 | $757,400 | $379,800 | $377,600 |
| 2015 | $9,281 | $740,700 | $363,100 | $377,600 |
Source: Public Records
Map
Nearby Homes