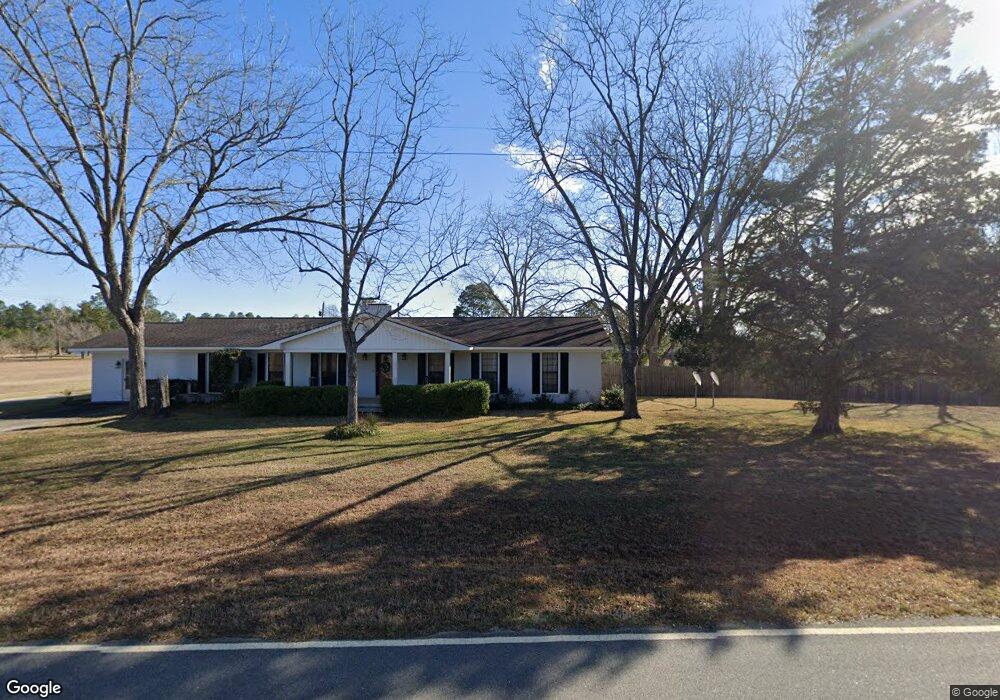
262 Thomas Chapel Rd Adrian, GA 31002
Estimated Value: $287,073 - $344,000
--
Bed
2
Baths
2,734
Sq Ft
$118/Sq Ft
Est. Value
About This Home
This home is located at 262 Thomas Chapel Rd, Adrian, GA 31002 and is currently estimated at $322,024, approximately $117 per square foot. 262 Thomas Chapel Rd is a home located in Laurens County with nearby schools including Northwest Laurens Elementary School, Southwest Laurens Elementary School, and East Laurens Primary School.
Ownership History
Date
Name
Owned For
Owner Type
Purchase Details
Closed on
Apr 21, 2020
Sold by
Moorman Stuart Chipley
Bought by
Moorman Stuart Chipley and Moorman Kasey D
Current Estimated Value
Home Financials for this Owner
Home Financials are based on the most recent Mortgage that was taken out on this home.
Original Mortgage
$187,178
Interest Rate
3.5%
Mortgage Type
New Conventional
Purchase Details
Closed on
Jun 5, 2015
Sold by
Moorman Sara Benita
Bought by
Moorman Stuart Chipley
Purchase Details
Closed on
Feb 5, 2009
Sold by
Moorman Harold C
Bought by
Moorman Sara Benita and Moorman Harold Tyrus
Purchase Details
Closed on
Jul 31, 1996
Sold by
Same
Bought by
Moorman Harold C
Purchase Details
Closed on
Sep 9, 1909
Create a Home Valuation Report for This Property
The Home Valuation Report is an in-depth analysis detailing your home's value as well as a comparison with similar homes in the area
Home Values in the Area
Average Home Value in this Area
Purchase History
| Date | Buyer | Sale Price | Title Company |
|---|---|---|---|
| Moorman Stuart Chipley | -- | -- | |
| Moorman Stuart Chipley | $60,000 | -- | |
| Moorman Sara Benita | -- | -- | |
| Moorman Harold C | -- | -- | |
| -- | -- | -- |
Source: Public Records
Mortgage History
| Date | Status | Borrower | Loan Amount |
|---|---|---|---|
| Closed | Moorman Stuart Chipley | $187,178 |
Source: Public Records
Tax History Compared to Growth
Tax History
| Year | Tax Paid | Tax Assessment Tax Assessment Total Assessment is a certain percentage of the fair market value that is determined by local assessors to be the total taxable value of land and additions on the property. | Land | Improvement |
|---|---|---|---|---|
| 2024 | $1,957 | $92,964 | $9,894 | $83,070 |
| 2023 | $1,810 | $85,226 | $9,894 | $75,332 |
| 2022 | $1,804 | $84,938 | $9,606 | $75,332 |
| 2021 | $1,634 | $74,930 | $7,898 | $67,032 |
| 2020 | $1,096 | $50,194 | $7,898 | $42,296 |
| 2019 | $1,096 | $50,194 | $7,898 | $42,296 |
| 2018 | $1,098 | $50,194 | $7,898 | $42,296 |
| 2017 | $1,097 | $50,194 | $7,898 | $42,296 |
| 2016 | $1,098 | $50,194 | $7,898 | $42,296 |
| 2015 | $1,098 | $50,194 | $7,898 | $42,296 |
| 2014 | -- | $40,467 | $8,540 | $31,926 |
Source: Public Records
Map
Nearby Homes
- 117 Lovett Scott Rd
- 1739 Snellbridge Rd
- 467 Alton Stewart Rd
- 0 Alton Stewart Rd Unit 10628094
- 0 Old Carter Rd
- 84 J D Garnto Rd
- 509 Maddox Rd
- 0 Red Hill Cemetery Rd Unit 30103
- 0 Red Hill Cemetery Rd Unit 10564131
- 0 Stone Church Rd Unit 10636232
- 0 Stone Church Rd Unit 25420128
- 0 Stone Church Rd Unit 25261642
- 250 Archers Pond Smith Rd
- 0 Hubert Fulford Rd Unit 22123639
- Pendleton Rreek Rd
- 0 Pendleton Creek Rd Unit SA340356
- NA Rd
- 6.98 ACRES Brewton Lovett Rd
- 3.5 ACRES Brewton Lovett Rd
- 9.56 ACRES Brewton Lovett Rd
- 270 Thomas Chapel Rd
- 2063 Bay Springs Rd
- 2099 Bay Springs Rd
- 2139 Bay Springs Rd
- 0 Thomas Chapel Rd Unit 3024254
- 375 Thomas Chapel Rd
- 00000 Thomas Ln
- 271 Lovett Scott Rd
- 257 Lovett Scott Rd
- 1993 Snellbridge Rd
- 289 Lovett Scott Rd
- 297 Lovett Scott Rd
- 2273 Bay Springs Rd
- 2201 Bay Springs Rd
- 266 Lovett Scott Rd
- 276 Lovett Scott Rd
- 244 Lovett Scott Rd
- 0 Lovett Scott Rd (35 20 Acres)
- 244 Lovett Scott Rd
- 282 Lovett Scott Rd