Estimated Value: $850,000 - $1,076,886
7
Beds
5
Baths
4,944
Sq Ft
$192/Sq Ft
Est. Value
About This Home
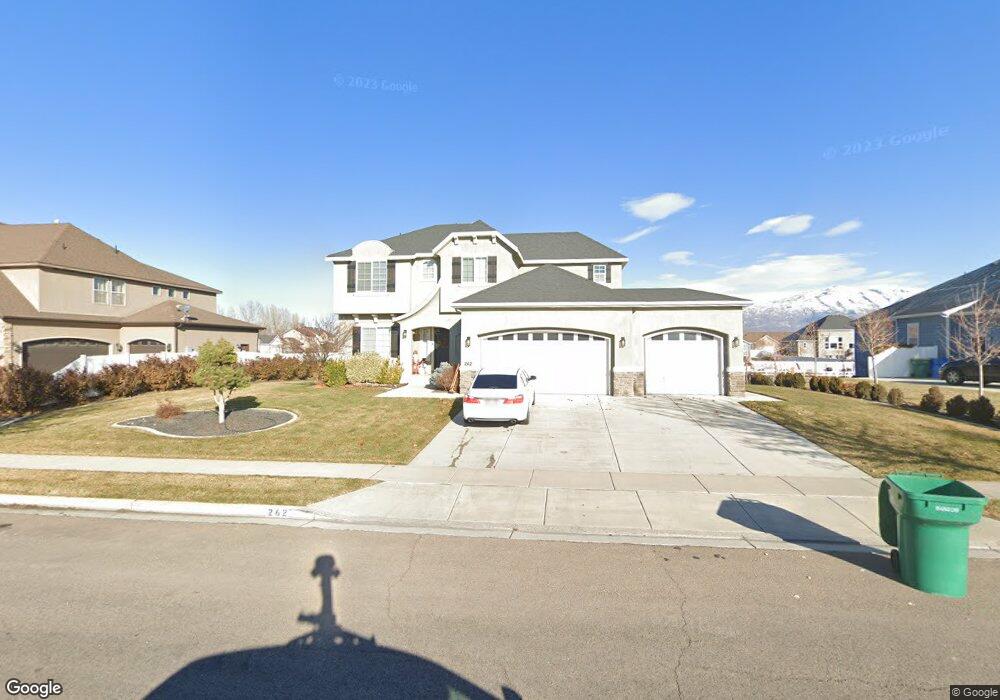
This home is located at 262 W 1100 S, Lehi, UT 84043 and is currently estimated at $947,962, approximately $191 per square foot. 262 W 1100 S is a home located in Utah County with nearby schools including Meadow Elementary School, Lehi Junior High School, and Lehi High School.
Ownership History
Date
Name
Owned For
Owner Type
Purchase Details
Closed on
Aug 30, 2022
Sold by
Oto Richard N
Bought by
Harrison Jesse P and Parker Julianne
Current Estimated Value
Home Financials for this Owner
Home Financials are based on the most recent Mortgage that was taken out on this home.
Original Mortgage
$647,200
Outstanding Balance
$619,733
Interest Rate
5.54%
Mortgage Type
Balloon
Estimated Equity
$328,229
Purchase Details
Closed on
Sep 24, 2020
Sold by
Oto Richard
Bought by
Oto Richard N and Oto Mari N
Home Financials for this Owner
Home Financials are based on the most recent Mortgage that was taken out on this home.
Original Mortgage
$212,000
Interest Rate
2.9%
Mortgage Type
New Conventional
Purchase Details
Closed on
Oct 31, 2012
Sold by
Salisbury Developers Inc
Bought by
Oto Richard N and Oto Mari N
Home Financials for this Owner
Home Financials are based on the most recent Mortgage that was taken out on this home.
Original Mortgage
$276,216
Interest Rate
3.43%
Mortgage Type
New Conventional
Create a Home Valuation Report for This Property
The Home Valuation Report is an in-depth analysis detailing your home's value as well as a comparison with similar homes in the area
Home Values in the Area
Average Home Value in this Area
Purchase History
| Date | Buyer | Sale Price | Title Company |
|---|---|---|---|
| Harrison Jesse P | -- | -- | |
| Oto Richard N | -- | Utah First Title Ins Agcy | |
| Otot Richard | -- | Utah First Title Ins Agcy | |
| Oto Richard N | -- | Provoland Title Co |
Source: Public Records
Mortgage History
| Date | Status | Borrower | Loan Amount |
|---|---|---|---|
| Open | Harrison Jesse P | $647,200 | |
| Previous Owner | Oto Richard N | $212,000 | |
| Previous Owner | Oto Richard N | $276,216 |
Source: Public Records
Tax History
| Year | Tax Paid | Tax Assessment Tax Assessment Total Assessment is a certain percentage of the fair market value that is determined by local assessors to be the total taxable value of land and additions on the property. | Land | Improvement |
|---|---|---|---|---|
| 2025 | $4,104 | $499,015 | -- | -- |
| 2024 | $4,104 | $480,315 | $0 | $0 |
| 2023 | $3,965 | $503,855 | $0 | $0 |
| 2022 | $3,721 | $458,370 | $0 | $0 |
| 2021 | $3,335 | $621,100 | $191,200 | $429,900 |
| 2020 | $3,144 | $578,800 | $177,000 | $401,800 |
| 2019 | $2,804 | $536,500 | $177,000 | $359,500 |
| 2018 | $2,740 | $495,700 | $172,700 | $323,000 |
| 2017 | $2,594 | $249,535 | $0 | $0 |
| 2016 | $2,740 | $244,475 | $0 | $0 |
| 2015 | $2,525 | $213,895 | $0 | $0 |
| 2014 | $2,247 | $189,255 | $0 | $0 |
Source: Public Records
Map
Nearby Homes
Your Personal Tour Guide
Ask me questions while you tour the home.