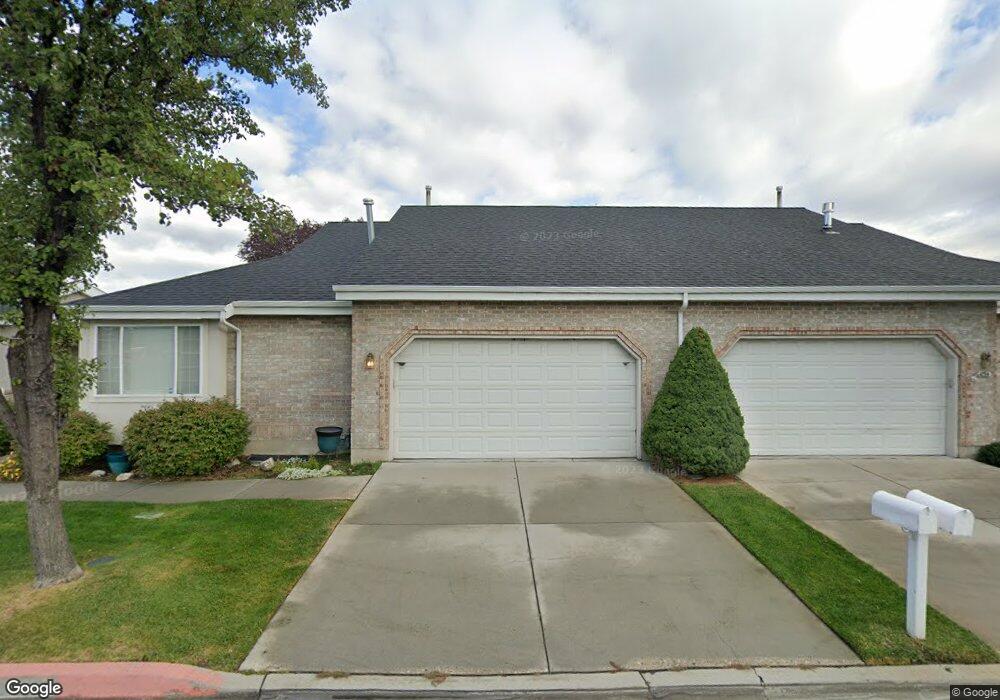
262 W 170 N Orem, UT 84057
Suncrest NeighborhoodEstimated Value: $434,387 - $474,000
3
Beds
3
Baths
2,709
Sq Ft
$168/Sq Ft
Est. Value
About This Home
This home is located at 262 W 170 N, Orem, UT 84057 and is currently estimated at $455,129, approximately $168 per square foot. 262 W 170 N is a home located in Utah County with nearby schools including Orem Junior High School, Mountain View High School, and Noah Webster Academy.
Ownership History
Date
Name
Owned For
Owner Type
Purchase Details
Closed on
Mar 20, 2023
Sold by
Wilson Shirley Blanche
Bought by
Wilson Ronald Scott and Thomas Deanne Janae
Current Estimated Value
Purchase Details
Closed on
Oct 16, 2013
Sold by
Plehn Sybel
Bought by
Wilson Ronald George and Wilson Shirley Blanche
Home Financials for this Owner
Home Financials are based on the most recent Mortgage that was taken out on this home.
Original Mortgage
$172,525
Interest Rate
4.55%
Mortgage Type
New Conventional
Create a Home Valuation Report for This Property
The Home Valuation Report is an in-depth analysis detailing your home's value as well as a comparison with similar homes in the area
Home Values in the Area
Average Home Value in this Area
Purchase History
| Date | Buyer | Sale Price | Title Company |
|---|---|---|---|
| Wilson Ronald Scott | -- | Fidelity National Title | |
| Wilson Ronald George | -- | United West Title |
Source: Public Records
Mortgage History
| Date | Status | Borrower | Loan Amount |
|---|---|---|---|
| Previous Owner | Wilson Ronald George | $172,525 |
Source: Public Records
Tax History
| Year | Tax Paid | Tax Assessment Tax Assessment Total Assessment is a certain percentage of the fair market value that is determined by local assessors to be the total taxable value of land and additions on the property. | Land | Improvement |
|---|---|---|---|---|
| 2025 | $2,004 | $247,610 | -- | -- |
| 2024 | $2,004 | $245,025 | $0 | $0 |
| 2023 | $1,975 | $259,545 | $0 | $0 |
| 2022 | $1,696 | $215,985 | $0 | $0 |
| 2021 | $1,543 | $297,500 | $85,000 | $212,500 |
| 2020 | $1,454 | $275,500 | $85,000 | $190,500 |
| 2019 | $1,268 | $250,000 | $85,000 | $165,000 |
| 2018 | $1,328 | $250,000 | $85,000 | $165,000 |
| 2017 | $1,303 | $143,605 | $0 | $0 |
| 2016 | $1,255 | $114,125 | $0 | $0 |
| 2015 | $1,250 | $126,445 | $0 | $0 |
| 2014 | $1,313 | $114,950 | $0 | $0 |
Source: Public Records
Map
Nearby Homes
Your Personal Tour Guide
Ask me questions while you tour the home.