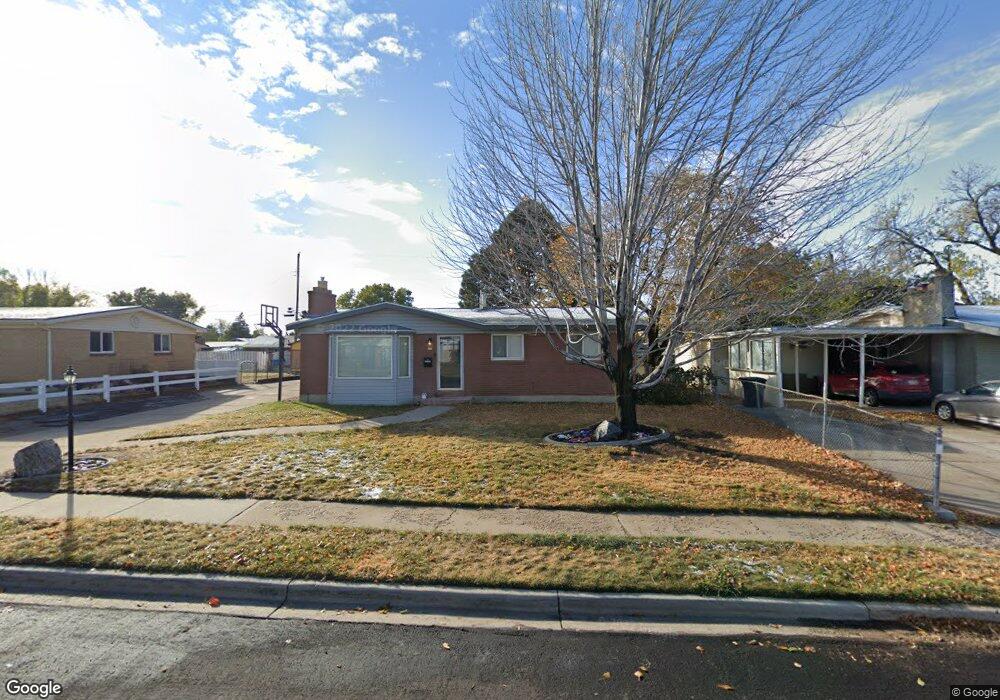
262 W 700 N Clearfield, UT 84015
Estimated Value: $359,000 - $429,000
4
Beds
2
Baths
2,246
Sq Ft
$174/Sq Ft
Est. Value
About This Home
This home is located at 262 W 700 N, Clearfield, UT 84015 and is currently estimated at $391,826, approximately $174 per square foot. 262 W 700 N is a home located in Davis County with nearby schools including Doxey Elementary School, North Davis Junior High School, and Clearfield High School.
Ownership History
Date
Name
Owned For
Owner Type
Purchase Details
Closed on
Aug 7, 2012
Sold by
Rayl Blake
Bought by
Nelson Daniel and Nelson Christine
Current Estimated Value
Home Financials for this Owner
Home Financials are based on the most recent Mortgage that was taken out on this home.
Original Mortgage
$132,050
Outstanding Balance
$90,936
Interest Rate
3.62%
Mortgage Type
New Conventional
Estimated Equity
$300,890
Purchase Details
Closed on
Feb 25, 2010
Sold by
Brown Erik G and Brown Candice
Bought by
Rayl Blake
Home Financials for this Owner
Home Financials are based on the most recent Mortgage that was taken out on this home.
Original Mortgage
$111,200
Interest Rate
4.97%
Mortgage Type
New Conventional
Purchase Details
Closed on
Aug 25, 2008
Sold by
Simmons Timothy Ford
Bought by
Brown Erik G and Brown Candice
Home Financials for this Owner
Home Financials are based on the most recent Mortgage that was taken out on this home.
Original Mortgage
$169,342
Interest Rate
6.37%
Mortgage Type
FHA
Create a Home Valuation Report for This Property
The Home Valuation Report is an in-depth analysis detailing your home's value as well as a comparison with similar homes in the area
Home Values in the Area
Average Home Value in this Area
Purchase History
| Date | Buyer | Sale Price | Title Company |
|---|---|---|---|
| Nelson Daniel | -- | First American Title | |
| Rayl Blake | -- | First American Title | |
| Brown Erik G | -- | Backman Title Services |
Source: Public Records
Mortgage History
| Date | Status | Borrower | Loan Amount |
|---|---|---|---|
| Open | Nelson Daniel | $132,050 | |
| Previous Owner | Rayl Blake | $111,200 | |
| Previous Owner | Brown Erik G | $169,342 |
Source: Public Records
Tax History
| Year | Tax Paid | Tax Assessment Tax Assessment Total Assessment is a certain percentage of the fair market value that is determined by local assessors to be the total taxable value of land and additions on the property. | Land | Improvement |
|---|---|---|---|---|
| 2025 | $2,283 | $204,600 | $71,287 | $133,313 |
| 2024 | $2,218 | $200,200 | $68,925 | $131,275 |
| 2023 | $2,070 | $343,000 | $110,323 | $232,677 |
| 2022 | $2,093 | $187,550 | $63,307 | $124,243 |
| 2021 | $1,883 | $255,000 | $67,057 | $187,943 |
| 2020 | $1,644 | $221,000 | $56,367 | $164,633 |
| 2019 | $1,612 | $214,000 | $59,172 | $154,828 |
| 2018 | $1,446 | $187,000 | $49,895 | $137,105 |
| 2016 | $1,265 | $85,525 | $20,970 | $64,555 |
| 2015 | $1,213 | $78,210 | $20,970 | $57,240 |
| 2014 | $1,205 | $78,711 | $20,970 | $57,741 |
| 2013 | -- | $57,033 | $24,484 | $32,549 |
Source: Public Records
Map
Nearby Homes
Your Personal Tour Guide
Ask me questions while you tour the home.