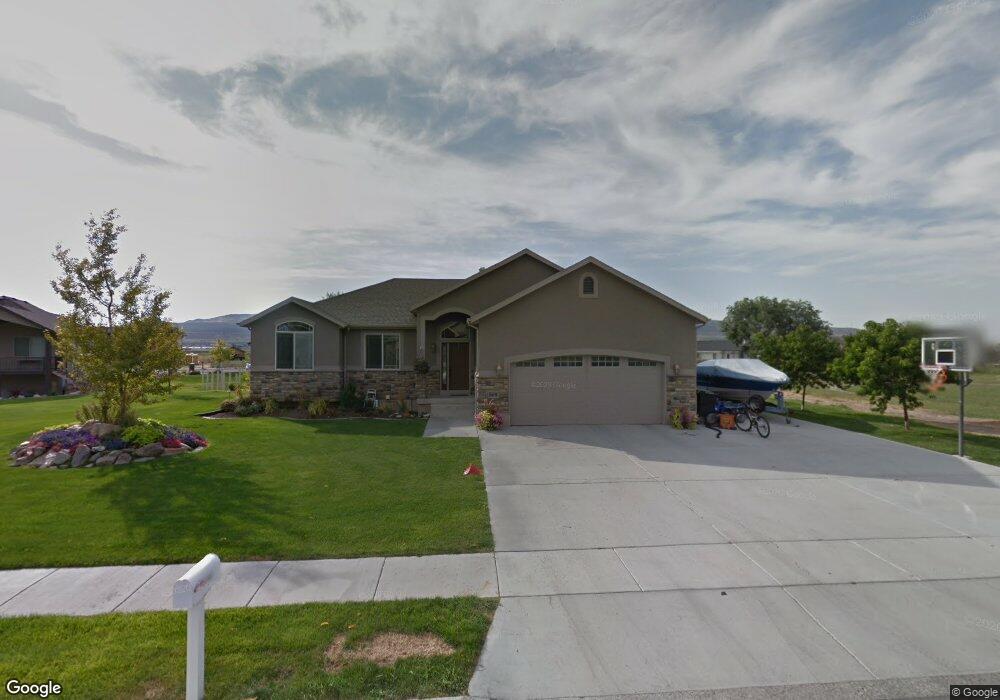
262 W 860 S Garland, UT 84312
Estimated Value: $484,000 - $545,000
6
Beds
4
Baths
3,393
Sq Ft
$151/Sq Ft
Est. Value
About This Home
This home is located at 262 W 860 S, Garland, UT 84312 and is currently estimated at $511,517, approximately $150 per square foot. 262 W 860 S is a home located in Box Elder County with nearby schools including Garland School, Bear River Middle School, and Alice C. Harris Intermediate School.
Ownership History
Date
Name
Owned For
Owner Type
Purchase Details
Closed on
Jul 2, 2020
Sold by
Bevan Ryan K and Bevan Lori J
Bought by
Richins Braiden and Richins Rachel
Current Estimated Value
Home Financials for this Owner
Home Financials are based on the most recent Mortgage that was taken out on this home.
Original Mortgage
$291,120
Outstanding Balance
$258,625
Interest Rate
3.2%
Mortgage Type
New Conventional
Estimated Equity
$252,892
Purchase Details
Closed on
Aug 3, 2007
Sold by
Kirkland Investment Inc
Bought by
Hartfiel Construction Inc
Home Financials for this Owner
Home Financials are based on the most recent Mortgage that was taken out on this home.
Original Mortgage
$215,000
Interest Rate
6.62%
Mortgage Type
Unknown
Create a Home Valuation Report for This Property
The Home Valuation Report is an in-depth analysis detailing your home's value as well as a comparison with similar homes in the area
Home Values in the Area
Average Home Value in this Area
Purchase History
| Date | Buyer | Sale Price | Title Company |
|---|---|---|---|
| Richins Braiden | -- | American Secure Ttl Tremonto | |
| Hartfiel Construction Inc | -- | None Available |
Source: Public Records
Mortgage History
| Date | Status | Borrower | Loan Amount |
|---|---|---|---|
| Open | Richins Braiden | $291,120 | |
| Previous Owner | Hartfiel Construction Inc | $215,000 | |
| Closed | Hartfiel Construction Inc | $0 |
Source: Public Records
Tax History Compared to Growth
Tax History
| Year | Tax Paid | Tax Assessment Tax Assessment Total Assessment is a certain percentage of the fair market value that is determined by local assessors to be the total taxable value of land and additions on the property. | Land | Improvement |
|---|---|---|---|---|
| 2025 | $2,730 | $469,521 | $110,000 | $359,521 |
| 2024 | $2,730 | $468,716 | $105,000 | $363,716 |
| 2023 | $2,862 | $484,696 | $100,000 | $384,696 |
| 2022 | $2,820 | $246,294 | $19,250 | $227,044 |
| 2021 | $2,352 | $312,739 | $35,000 | $277,739 |
| 2020 | $2,249 | $312,739 | $35,000 | $277,739 |
| 2019 | $2,095 | $154,433 | $19,250 | $135,183 |
| 2018 | $1,687 | $116,196 | $19,250 | $96,946 |
| 2017 | $1,751 | $211,266 | $19,250 | $176,266 |
| 2016 | $1,654 | $111,580 | $19,250 | $92,330 |
| 2015 | $1,537 | $103,186 | $19,250 | $83,936 |
| 2014 | $1,537 | $99,189 | $19,250 | $79,939 |
| 2013 | -- | $99,190 | $13,338 | $85,852 |
Source: Public Records
Map
Nearby Homes